

Urbanization
China’s Staggering Demand for Commodities
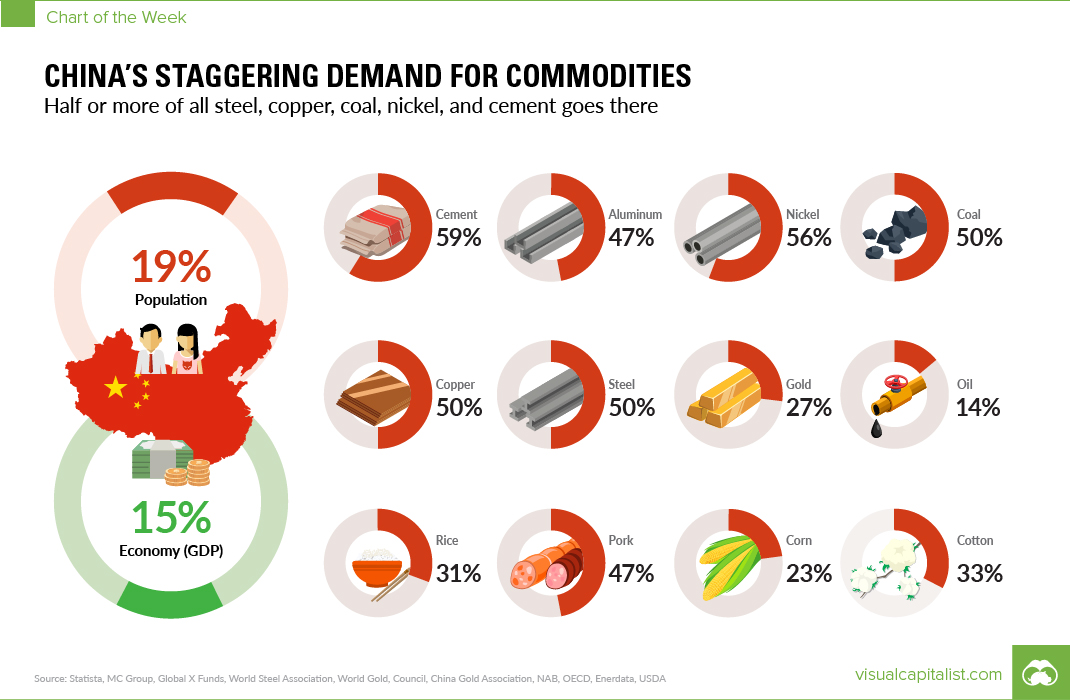
China’s Staggering Demand for Commodities
>50% of all steel, cement, nickel, and copper goes there
The Chart of the Week is a weekly Visual Capitalist feature on Fridays.
It’s said that in China, a new skyscraper is built every five days.
China is building often, and they are building higher. In fact, just last year, China completed 77 of the world’s 144 new supertall buildings, spread through 36 different Chinese cities. These are structures with a minimum height of 656 feet (200 meters).
For comparison’s sake, there are only 113 buildings in New York City’s current skyline that are over 600 feet.
Unbelievable Scale
It’s always hard to put China’s size and scope in perspective – and we’ve tried before by showing you 35 Chinese cities as big as countries, or highlighting the growing prominence of the domestic tech scene.
Today’s chart also falls in that category, and it focuses in on the raw materials that are needed to make all this growth possible.
| Year of data | Commodity | China's % of Global Demand | Source |
|---|---|---|---|
| 2017 | Cement | 59% | Statista |
| 2016 | Nickel | 56% | Statista |
| 2017 | Coal | 50% | NAB |
| 2016 | Copper | 50% | Global X Funds |
| 2017 | Steel | 50% | World Steel Association |
| 2017 | Aluminum | 47% | MC Group |
| 2016 | Pork | 47% | OECD |
| 2017 | Cotton | 33% | USDA |
| 2017 | Rice | 31% | Statista |
| 2017 | Gold | 27% | China Gold Association, WGC |
| 2017 | Corn | 23% | USDA |
| 2016 | Oil | 14% | Enerdata |
Note: Because this data is not all in one easy place, it is sourced from many different industry associations, banks, and publications. Most of the data comes from 2017, but some is from 2016.
China Demand > World
There are five particularly interesting commodity categories here – and in all of them, China’s demand equals or exceeds that of the rest of the world combined.
Cement: 59%
The primary ingredient in concrete is needed for roads, buildings, engineering structures (bridges, dams, etc.), foundations, and in making joints for drains and pipes.
Nickel: 57%
Nickel’s primary use is in making stainless steel, which is corrosion resistant. It also gets used in superalloys, batteries, and an array of other uses.
Steel: 50%
Steel is used for pretty much everything, but demand is primarily driven by the construction, machinery, and automotive sectors.
Copper: 50%
Copper is one of the metals driving the green revolution, and it’s used in electronics, wiring, construction, machinery, and automotive sectors, primarily.
Coal: 50%
China’s winding down coal usage – but when you have 1.4 billion people demanding power, it has to be done with that in mind. China has already hit peak coal, but the fossil fuel does still account for 65% of the country’s power generated by source.


Urbanization
Ranked: The 20 Most Air-Polluted Cities on Earth
Using 2022 average PM2.5 concentrations, we rank the most polluted cities in the world.


Ranked: The 20 Most Air-Polluted Cities on Earth
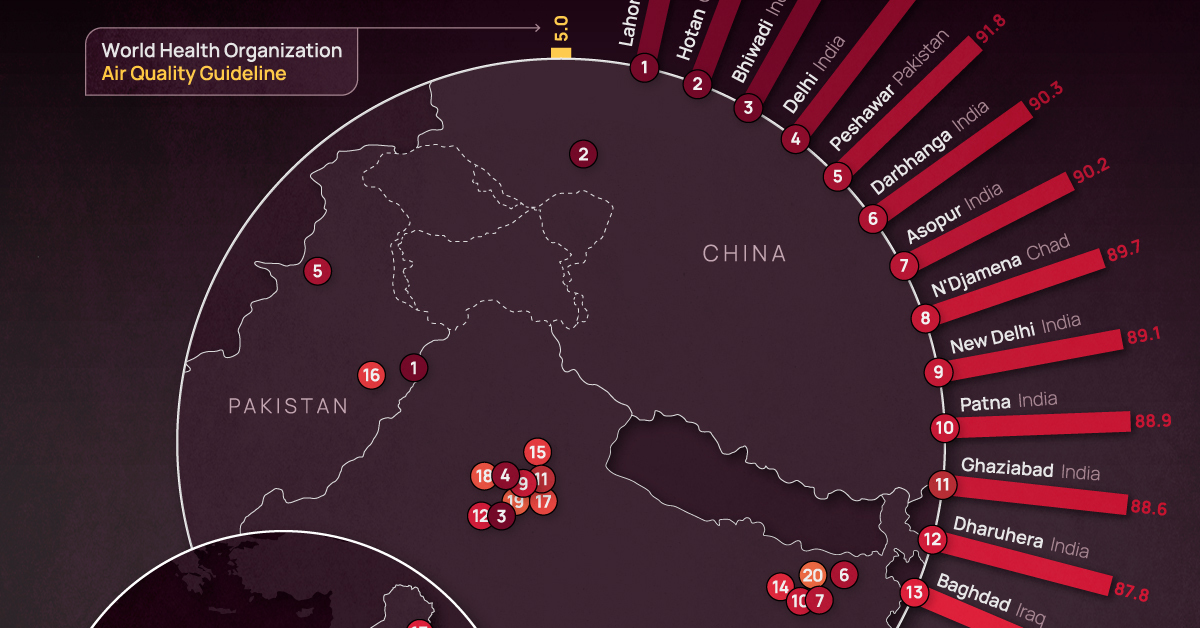
According to the World Health Organization (WHO), almost the entire global population (99%) breathes air that exceeds WHO air quality limits.
In the above map, we use 2022 average PM2.5 concentrations from IQAir’s World Air Quality Report to visualize the most air-polluted major cities in the world.
World’s Air Pollution Hot Spots
As one of the standard air quality indicators used by the WHO, the PM2.5 concentration refers to the quantity of fine particulate matter with a diameter of 2.5 micrometers or less in a given volume of air.
Fine particulate matter that is this small can penetrate the lungs when inhaled and enter the bloodstream, affecting all major organs.
Based on annual average PM2.5 concentrations (μg/m³) in 2022, here are the most polluted cities in the world.
| Rank | City | 2022 average PM2.5 concentration (μg/m³) |
|---|---|---|
| 1 | 🇵🇰 Lahore, Pakistan | 97.4 |
| 2 | 🇨🇳 Hotan, China | 94.3 |
| 3 | 🇮🇳 Bhiwadi, India | 92.7 |
| 4 | 🇮🇳 Delhi, India | 92.6 |
| 5 | 🇵🇰 Peshawar, Pakistan | 91.8 |
| 6 | 🇮🇳 Darbhanga, India | 90.3 |
| 7 | 🇮🇳 Asopur, India | 90.2 |
| 8 | 🇹🇩 N'Djamena, Chad | 89.7 |
| 9 | 🇮🇳 New Delhi, India | 89.1 |
| 10 | 🇮🇳 Patna, India | 88.9 |
| 11 | 🇮🇳 Ghaziabad, India | 88.6 |
| 12 | 🇮🇳 Dharuhera, India | 87.8 |
| 13 | 🇮🇶 Baghdad, Iraq | 86.7 |
| 14 | 🇮🇳 Chapra, India | 85.9 |
| 15 | 🇮🇳 Muzaffarnagar, India | 85.5 |
| 16 | 🇵🇰 Faisalabad, Pakistan | 84.5 |
| 17 | 🇮🇳 Greater Noida, India | 83.2 |
| 18 | 🇮🇳 Bahadurgarh, India | 82.2 |
| 19 | 🇮🇳 Faridabad, India | 79.7 |
| 20 | 🇮🇳 Muzaffarpur, India | 79.2 |
With numbers these high, the concentration of some or all of the following pollutants are at dangerous levels in these cities:
- Ground-level ozone
- Particulate matter
- Carbon monoxide
- Sulfur dioxide
- Nitrogen dioxide
At the top of the list, Lahore in Pakistan has a combination of high vehicle and industrial emissions, as well as smoke from brick kilns, crop residue, general waste burning, and dust from construction sites.
Air pollution levels can also be impacted by practices such as large-scale tree removal in order to build new roads and buildings.
As a result of its growing population and rapidly expanding industrial sector, India has 14 cities on the list, outpacing China, formerly considered the world’s number one air pollution source.
The only African country on the list, Chad, experienced severe dust storms in 2022 that resulted in an 18% increase in PM2.5 concentration in 2022 compared to the previous year.
The Cost of Poor Air Quality
Poor air quality is one of the leading causes of early deaths worldwide, just behind high blood pressure, tobacco use, and poor diet.
According to a 2020 study by the Health Effects Institute, 6.67 million people died as a result of air pollution in 2019.
In addition to the millions of premature deaths each year, the global cost of health damages associated with air pollution currently sits at $8.1 trillion.
Urbanization
Visualizing the World’s Largest Steel-Producing Countries
China has dominated global steel production the past few decades, but how did the country get here, and is its production growth over?
The Largest Steel-Producing Countries: Visualized
Steel is a critical component of modern industry and economy, essential for the construction of buildings, automobiles, and many other appliances and infrastructure used in our daily lives.
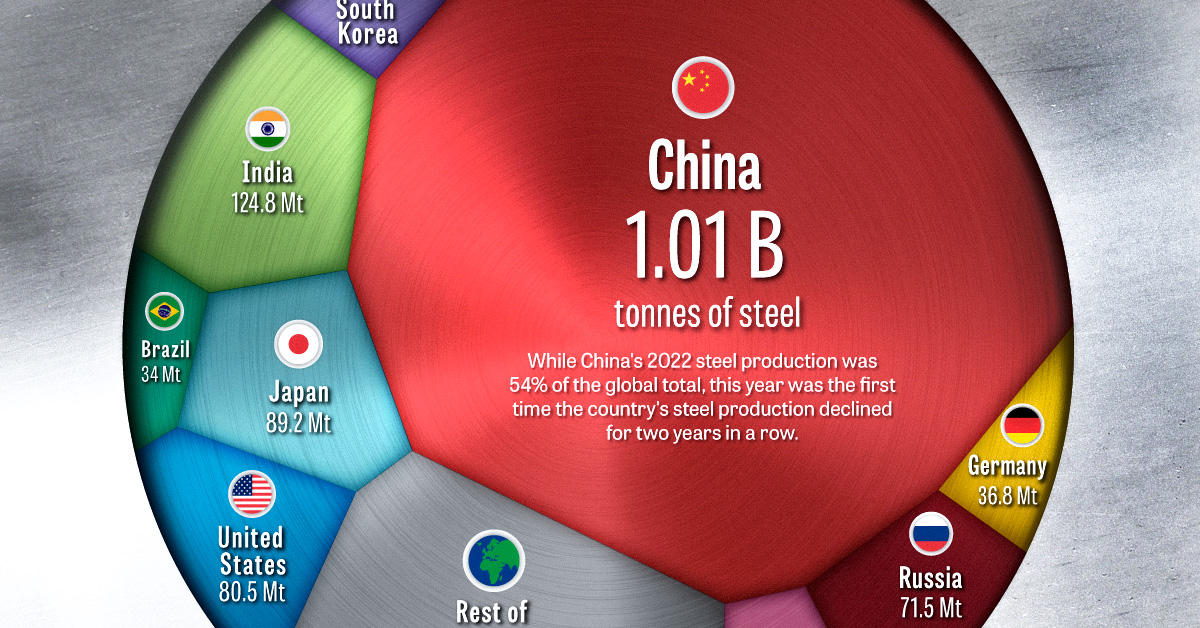
This graphic uses data from the World Steel Association to visualize the world’s top steel-producing countries, and highlights China’s ascent to the top, as it now makes up more than half of the world’s steel production.
The State of Global Steel Production
Global steel production in 2022 reached 1,878 million tonnes, barely surpassing the pre-pandemic production of 1,875 million tonnes in 2019.
| Country | 2022 Production (in million tonnes) | Annual Production Change | Global Share |
|---|---|---|---|
| 🇨🇳 China | 1013.0 | -2.0% | 53.9% |
| 🇮🇳 India | 124.8 | 5.3% | 6.6% |
| 🇯🇵 Japan | 89.2 | -7.9% | 4.8% |
| 🇺🇸 United States | 80.5 | -6.5% | 4.3% |
| 🇷🇺 Russia | 71.5 | -5.8% | 3.8% |
| 🇰🇷 South Korea | 65.9 | -6.9% | 3.5% |
| 🇩🇪 Germany | 36.8 | -8.8% | 2.0% |
| 🇹🇷 Türkiye | 35.1 | -15.0% | 1.9% |
| 🇧🇷 Brazil | 34.0 | -6.5% | 1.8% |
| 🇮🇷 Iran | 30.6 | 6.8% | 1.6% |
| 🇮🇹 Italy | 21.6 | -13.0% | 1.1% |
| 🇹🇼 Taiwan | 20.7 | -12.1% | 1.1% |
| 🇻🇳 Vietnam | 20.0 | -15.0% | 1.1% |
| 🇲🇽 Mexico | 18.2 | -1.9% | 1.0% |
| 🇮🇩 Indonesia | 15.6 | 8.3% | 0.8% |
| Rest of World | 201.0 | -11.2% | 10.7% |
| World Total | 1878.5 | -3.9% | 100.0% |
2022’s steel production marked a significant reduction compared to the post-pandemic rebound of 1,960 million tonnes in 2021, with a year-over-year decline of 4.2%–the largest drop since 2009, and prior to that, 1991.
This decline was spread across many of the world’s top steel producers, with only three of the top fifteen countries, India, Iran, and Indonesia, increasing their yearly production. Most of the other top steel-producing countries saw annual production declines of more than 5%, with Turkey, Italy, Taiwan, and Vietnam’s production all declining by double digits.
Even the world’s top steel-producing nation, China, experienced a modest 2% decline, which due to the country’s large production amounted to a decline of 19.8 million tonnes, more than many other nations produce in a year.
Despite India, the world’s second-largest steel producer, increasing its production by 5.3%, the country’s output still amounts to just over one-tenth of the steel produced by China.
China’s Meteoric Rise in Steel Production
Although China dominates the world’s steel production with more than a 54% share today, this hasn’t always been the case.
In 1967, the World Steel Association’s first recorded year of steel production figures, China only produced an estimated 14 million tonnes, making up barely 3% of global output. At that time, the U.S. and the USSR were competing as the world’s top steel producers at 115 and 102 million tonnes respectively, followed by Japan at 62 million tonnes.
Almost three decades later in 1996, China had successively overtaken Russia, the U.S., and Japan to become the top steel-producing nation with 101 million tonnes of steel produced that year.
The early 2000s marked a period of rapid growth for China, with consistent double-digit percentage increases in steel production each year.
The Recent Decline in China’s Steel Production
Since the early 2000s, China’s average annual growth in steel production has slowed to 3.4% over the last decade (2013-2022), a considerable decline compared to the previous decade’s (2003-2012) 15.2% average annual growth rate.
The past couple of years have seen China’s steel production decline, with 2021 and 2022 marking the first time the country’s production fell for two consecutive years in a row.
While it’s unlikely China will relinquish its position as the top steel-producing nation anytime soon, it remains to be seen whether this recent decline marks the beginning of a new trend or just a brief deviation from the country’s consistent production growth.

-

 Electrification3 years ago
Ranked: The Top 10 EV Battery Manufacturers
-

 Electrification2 years ago
The Key Minerals in an EV Battery
-

 Real Assets3 years ago
The World’s Top 10 Gold Mining Companies
-

 Misc3 years ago
All the Metals We Mined in One Visualization
-

 Electrification3 years ago
The Biggest Mining Companies in the World in 2021
-

 Energy Shift2 years ago
What Are the Five Major Types of Renewable Energy?
-

 Electrification2 years ago
Mapped: Solar Power by Country in 2021
-

 Electrification2 years ago
The World’s Largest Nickel Mining Companies