

Energy Shift
The Safest Source of Energy Will Surprise You
The World’s Safest Source of Energy Will Surprise You
When it comes to conversations on energy, it’s hard to leave your feelings at the door.
It’s arguable that energy is the single most important driver of human progress – it’s a multi-trillion dollar industry that powers our daily lives, technological advancements, and even the economic development of entire countries. At the same time, our choices around energy can have significant consequences. How we decide to generate energy can decimate the environment, fuel political conflicts, and even cause human deaths as unwelcome side effects.
The outcomes from our choices around energy are so vivid, that we’ve developed strong and polarized associations with the subject at hand.
The Empirical Perspective
Today’s visualization on the safest sources of energy comes to us from Cambridge House, the company hosting the International Mining Investment Conference 2018 on May 15-16 in Vancouver, BC, and it uses an empirical approach to compare different energy sources with one another.
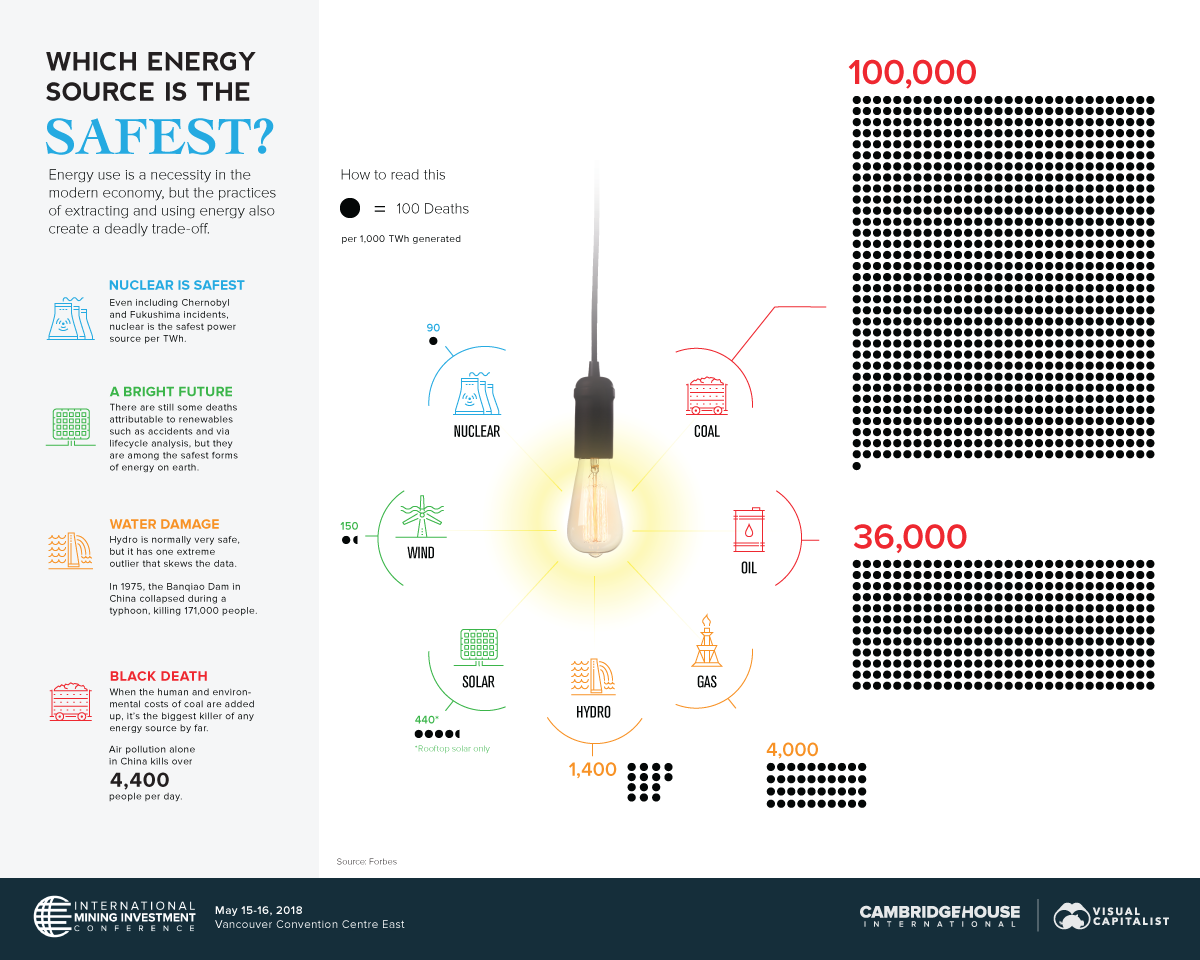
Based on the data, this comparison provides a perspective that will be surprising to many viewers. Despite its perceived dangers, nuclear is actually the safest type of energy.
| Energy Source | Deaths per 1,000 TWh | % of Global Primary Energy Supply (2015) |
|---|---|---|
| Coal | 100,000 | 28.1% |
| Oil | 36,000 | 31.7% |
| Natural Gas | 4,000 | 21.6% |
| Hydro | 1,400 | 2.5% |
| Solar | 440* | <1% |
| Wind | 150 | <1% |
| Nuclear | 90 | 4.9% |
That’s right – even when including seemingly catastrophic incidents such as Chernobyl and Fukushima in the calculations, the math says that the amount of energy generated by nuclear is so vast that it more than outweighs these incidents over the long-term.
The reality is that nuclear energy is much more comparable to renewables like solar or wind, in terms of safety. More importantly, it’s on the polar opposite of the spectrum from coal, which manages to kill 4,400 people daily in China alone.
The Nuclear Option
Interestingly, multiple studies have come to this exact same conclusion, including the ones used in an analysis by economist Max Roser’s project called Our World in Data.
Even though the conclusion on nuclear is pretty cut and dry, it’s still hard to absorb. After all, the relative safety of nuclear ends up being extremely counter-intuitive to our human brains, which are seemingly wired to put more weight on big, memorable events (i.e. Chernobyl) rather than slow, consistent deaths that occur over time with other energy sources.
Today, nuclear provides about 11% of the world’s electricity from about 450 power reactors, generating about 2,500 TWh of electricity each year.
And while there are still questions that remain – specifically revolving around how to store certain types of nuclear waste – the above data explains why the majority of scientists classify nuclear as a sustainable and safe energy source, along with other renewables.
This post originally appeared on Visual Capitalist’s new VC Metals channel, home to data-driven visual content on metals, commodities, and energy.


Energy Shift
The World’s Biggest Oil Producers in 2023
Just three countries accounted for 40% of global oil production last year.

The World’s Biggest Oil Producers in 2023
This was originally posted on our Voronoi app. Download the app for free on iOS or Android and discover incredible data-driven charts from a variety of trusted sources.
Despite efforts to decarbonize the global economy, oil still remains one of the world’s most important resources. It’s also produced by a fairly limited group of countries, which can be a source of economic and political leverage.
This graphic illustrates global crude oil production in 2023, measured in million barrels per day, sourced from the U.S. Energy Information Administration (EIA).
Three Countries Account for 40% of Global Oil Production
In 2023, the United States, Russia, and Saudi Arabia collectively contributed 32.7 million barrels per day to global oil production.
| Oil Production 2023 | Million barrels per day |
|---|---|
| 🇺🇸 U.S. | 12.9 |
| 🇷🇺 Russia | 10.1 |
| 🇸🇦 Saudi Arabia | 9.7 |
| 🇨🇦 Canada | 4.6 |
| 🇮🇶 Iraq | 4.3 |
| 🇨🇳 China | 4.2 |
| 🇮🇷 Iran | 3.6 |
| 🇧🇷 Brazil | 3.4 |
| 🇦🇪 UAE | 3.4 |
| 🇰🇼 Kuwait | 2.7 |
| 🌍 Other | 22.8 |
These three nations have consistently dominated oil production since 1971. The leading position, however, has alternated among them over the past five decades.
In contrast, the combined production of the next three largest producers—Canada, Iraq, and China—reached 13.1 million barrels per day in 2023, just surpassing the production of the United States alone.
In the near term, no country is likely to surpass the record production achieved by the U.S. in 2023, as no other producer has ever reached a daily capacity of 13.0 million barrels. Recently, Saudi Arabia’s state-owned Saudi Aramco scrapped plans to increase production capacity to 13.0 million barrels per day by 2027.
In 2024, analysts forecast that the U.S. will maintain its position as the top oil producer. In fact, according to Macquarie Group, U.S. oil production is expected to achieve a record pace of about 14 million barrels per day by the end of the year.
Energy Shift
How Much Does the U.S. Depend on Russian Uranium?
Despite a new uranium ban being discussed in Congress, the U.S. is still heavily dependent on Russian uranium.

How Much Does the U.S. Depend on Russian Uranium?
This was originally posted on our Voronoi app. Download the app for free on iOS or Android and discover incredible data-driven charts from a variety of trusted sources.
The U.S. House of Representatives recently passed a ban on imports of Russian uranium. The bill must pass the Senate before becoming law.
In this graphic, we visualize how much the U.S. relies on Russian uranium, based on data from the United States Energy Information Administration (EIA).
U.S. Suppliers of Enriched Uranium
After Russia invaded Ukraine, the U.S. imposed sanctions on Russian-produced oil and gas—yet Russian-enriched uranium is still being imported.
Currently, Russia is the largest foreign supplier of nuclear power fuel to the United States. In 2022, Russia supplied almost a quarter of the enriched uranium used to fuel America’s fleet of more than 90 commercial reactors.
| Country of enrichment service | SWU* | % |
|---|---|---|
| 🇺🇸 United States | 3,876 | 27.34% |
| 🇷🇺 Russia | 3,409 | 24.04% |
| 🇩🇪 Germany | 1,763 | 12.40% |
| 🇬🇧 United Kingdom | 1,593 | 11.23% |
| 🇳🇱 Netherlands | 1,303 | 9.20% |
| Other | 2,232 | 15.79% |
| Total | 14,176 | 100% |
SWU stands for “Separative Work Unit” in the uranium industry. It is a measure of the amount of work required to separate isotopes of uranium during the enrichment process. Source: U.S. Energy Information Administration
Most of the remaining uranium is imported from European countries, while another portion is produced by a British-Dutch-German consortium operating in the United States called Urenco.
Similarly, nearly a dozen countries around the world depend on Russia for more than half of their enriched uranium—and many of them are NATO-allied members and allies of Ukraine.
In 2023 alone, the U.S. nuclear industry paid over $800 million to Russia’s state-owned nuclear energy corporation, Rosatom, and its fuel subsidiaries.
It is important to note that 19% of electricity in the U.S. is powered by nuclear plants.
The dependency on Russian fuels dates back to the 1990s when the United States turned away from its own enrichment capabilities in favor of using down-blended stocks of Soviet-era weapons-grade uranium.
As part of the new uranium-ban bill, the Biden administration plans to allocate $2.2 billion for the expansion of uranium enrichment facilities in the United States.

-

 Electrification3 years ago
Ranked: The Top 10 EV Battery Manufacturers
-

 Electrification2 years ago
The Key Minerals in an EV Battery
-

 Real Assets3 years ago
The World’s Top 10 Gold Mining Companies
-

 Misc3 years ago
All the Metals We Mined in One Visualization
-

 Energy Shift2 years ago
What Are the Five Major Types of Renewable Energy?
-

 Electrification2 years ago
Mapped: Solar Power by Country in 2021
-

 Electrification2 years ago
The World’s Largest Nickel Mining Companies
-

 Electrification3 years ago
How Much Land is Needed to Power the U.S. with Solar?