

Energy Shift
The Raw Materials That Fuel the Green Revolution
The Raw Materials That Fuel the Green Revolution
View the high resolution version of today’s graphic by clicking here.
Records for renewable energy consumption were smashed around the world in 2017.
Looking at national and state grids, progress has been extremely impressive. In Costa Rica, for example, renewable energy supplied five million people with all of their electricity needs for a stretch of 300 consecutive days. Meanwhile, the U.K. broke 13 green energy records in 2017 alone, and California’s largest grid operator announced it got 67.2% of its energy from renewables (excluding hydro) on May 13, 2017.
The corporate front is also looking promising, and Google has led the way by buying 536 MW of wind power to offset 100% of the company’s electricity usage. This makes the tech giant the biggest corporate purchaser of renewable energy on the planet.
But while these examples are plentiful, this progress is only the tip of the iceberg – and green energy still represents a small but rapidly growing segment. For a full green shift to occur, we’ll need to 10x what we’re currently sourcing from renewables.
To do this, we will need to procure massive amounts of natural resources – they just won’t be the fossil fuels that we’re used to.
Green Metals Required
Today’s infographic comes from Cambridge House as a part of the lead-up to their flagship conference, the Vancouver Resource Investment Conference 2018.
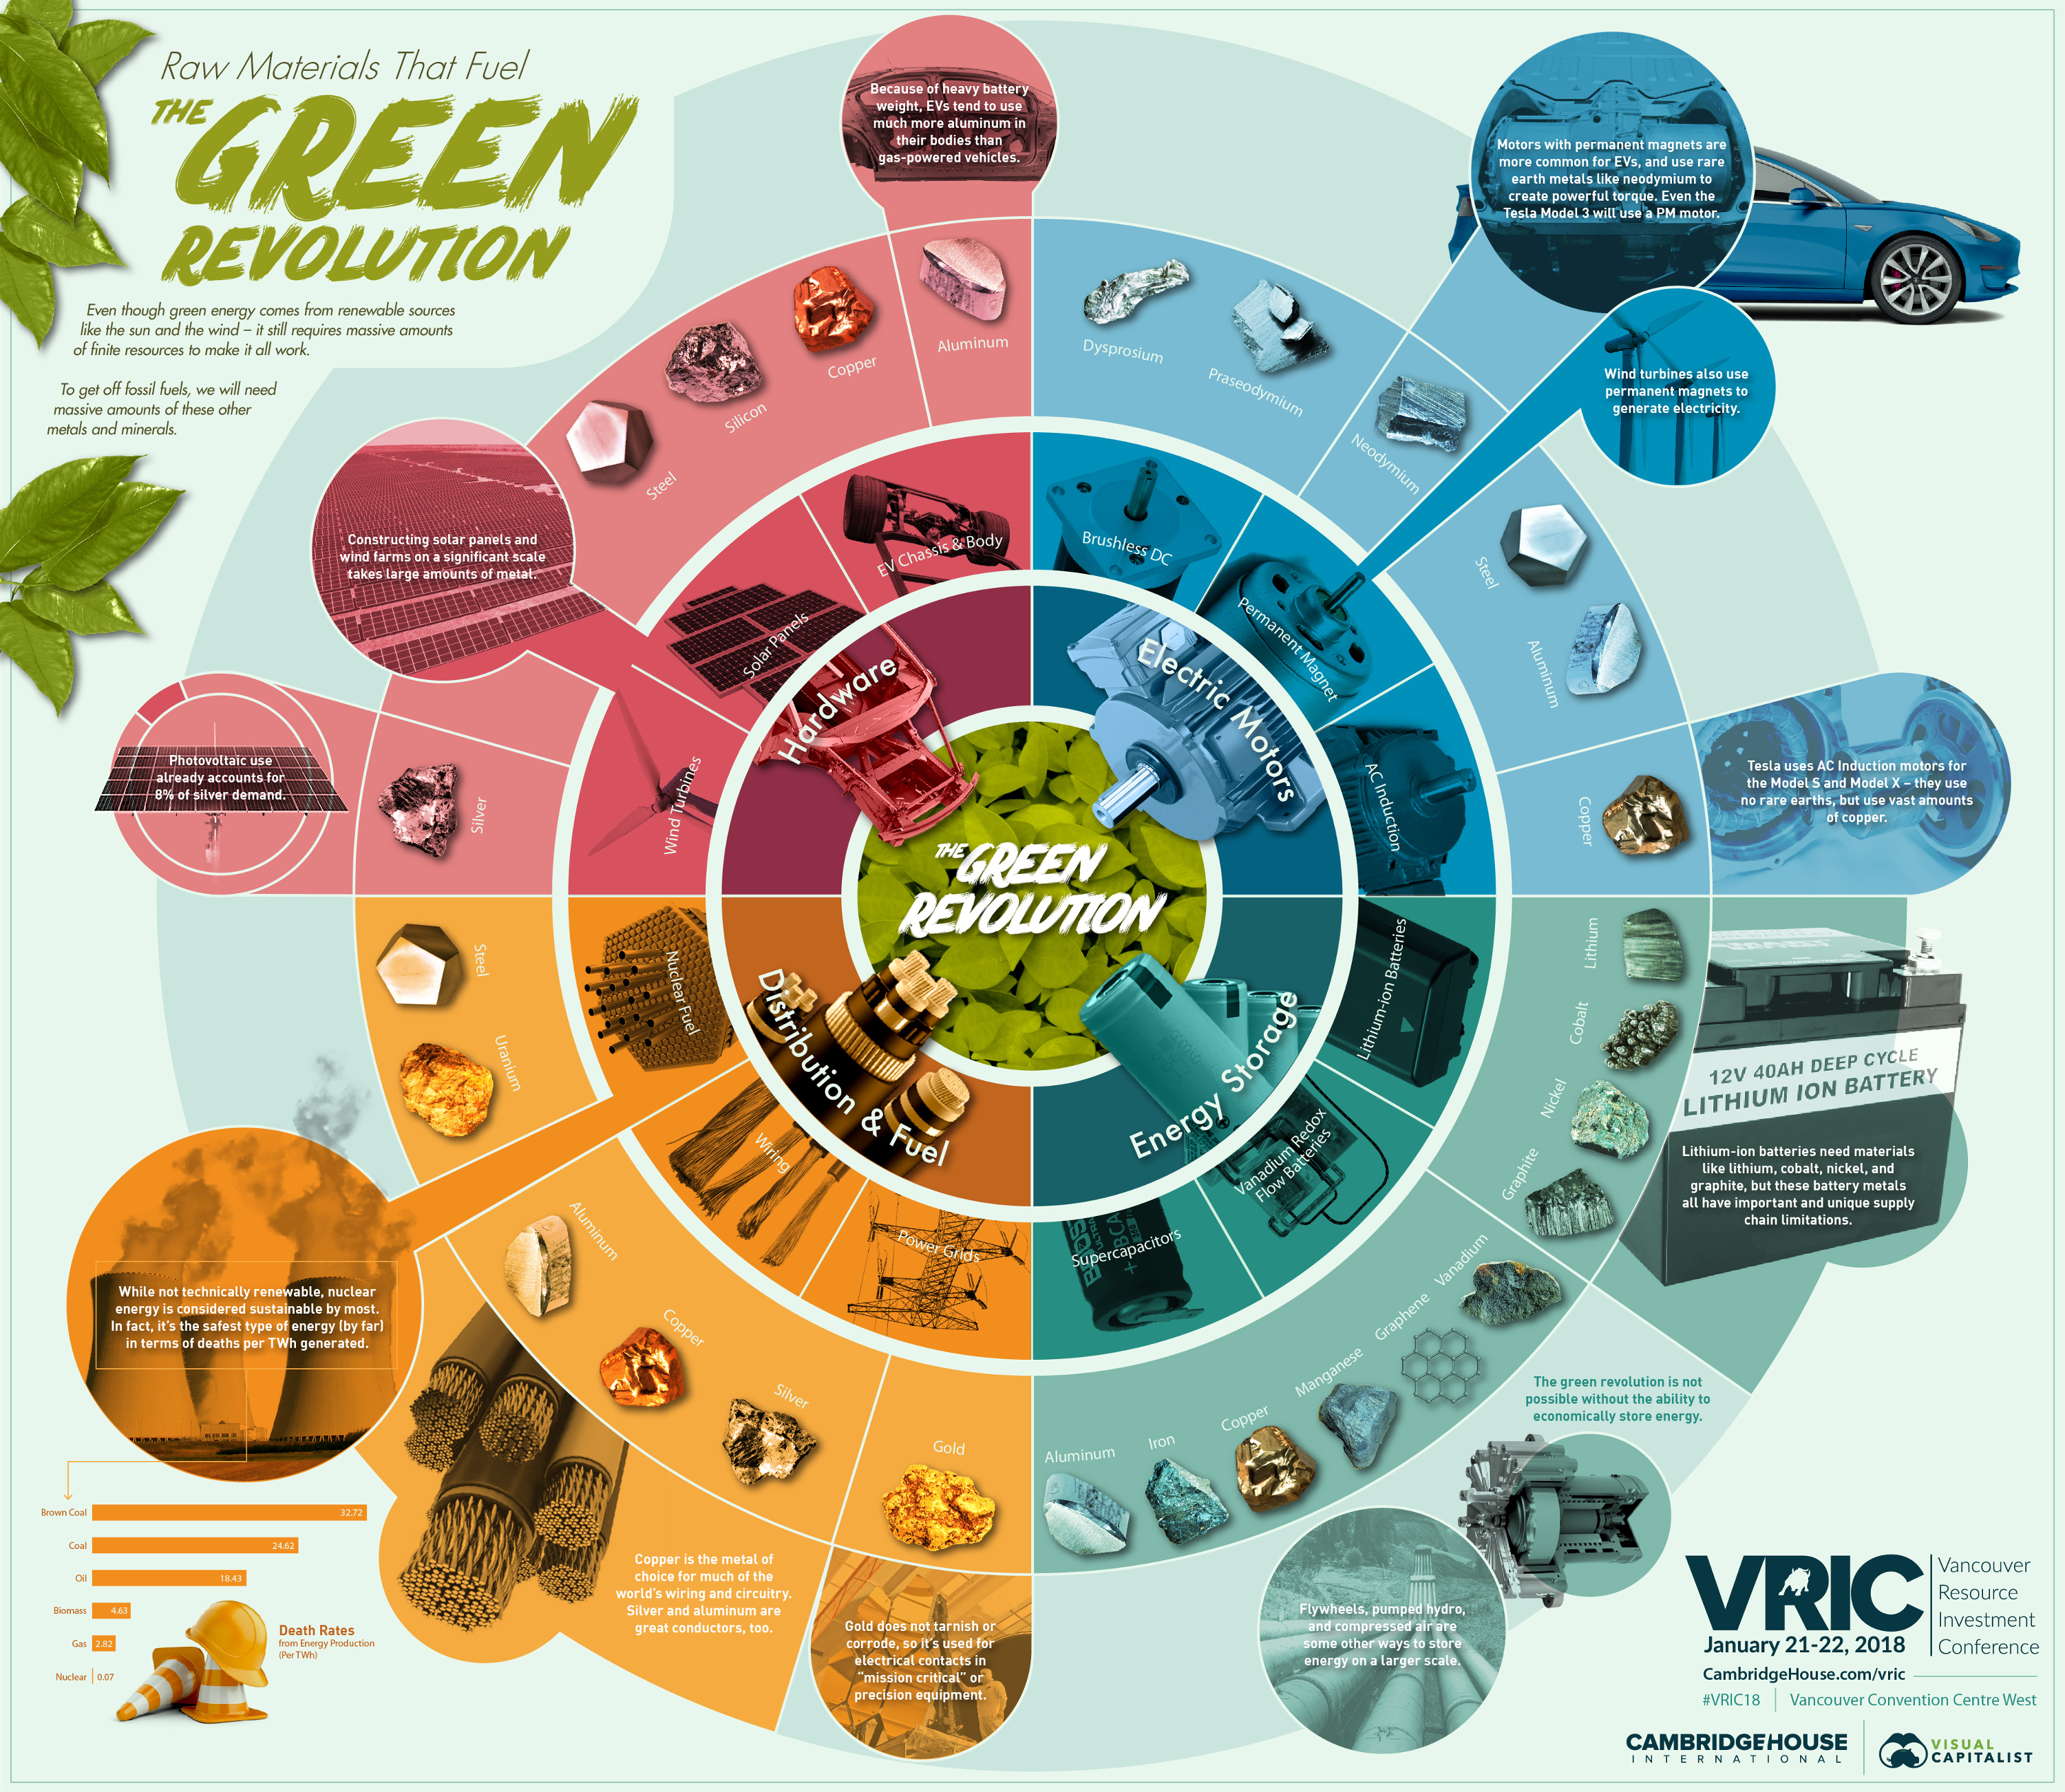
A major theme of the conference is sustainable energy – and the math indeed makes it clear that to fully transition to a green economy, we’ll need vast amounts of metals like copper, silicon, aluminum, lithium, cobalt, rare earths, and silver.
These metals and minerals are needed to generate, store, and distribute green energy. Without them, the reality is that technologies like solar panels, wind turbines, lithium-ion batteries, nuclear reactors, and electric vehicles are simply not possible.
First Principles
How do you get a Tesla to drive over 300 miles (480 km) on just one charge?
Here’s what you need: a lightweight body, a powerful electric motor, a cutting-edge battery that can store energy efficiently, and a lot of engineering prowess.
Putting the engineering aside, all of these things need special metals to work. For the lightweight body, aluminum is being substituted in for steel. For the electric motor, Tesla is using AC induction motors (Model S and X) that require large amounts of copper and aluminum. Meanwhile, Chevy Bolts and soon Tesla will use permanent magnet motors (in the Model 3) that use rare earths like neodymium, dysprosium, and praseodymium.
The batteries, as we’ve shown in our five-part Battery Series, are a whole other supply chain challenge. The lithium-ion batteries used in EVs need lithium, nickel, cobalt, graphite, and many other metals or minerals to function. Each Tesla battery, by the way, weighs about 1,200 lbs (540 kg) and makes up 25% the total mass of the car.
While EVs are a topic we’ve studied in depth, the same principles apply for solar panels, wind turbines, nuclear reactors, grid-scale energy storage solutions, or anything else we need to secure a sustainable future. Solar panels need silicon and silver, while wind turbines need rare earths, steel, and aluminum.
Even nuclear, which is the safest energy type by deaths per TWh and generates barely any emissions, needs uranium in order to generate power.
The Pace of Progress
The green revolution is happening at a breakneck speed – and new records will continue to be set each year.
Over $200 billion was invested into renewables in 2016, and more net renewable capacity was added than coal and gas put together:
| Power Type | Net Global Capacity Added (2016) |
|---|---|
| Renewable (excl. large hydro) | 138 GW |
| Coal | 54 GW |
| Gas | 37 GW |
| Large hydro | 15 GW |
| Nuclear | 10 GW |
| Other flexible capacity | 5 GW |
The numbers suggest that this is the only start of the green revolution.
However, to fully work our way off of fossil fuels, we will need to procure large amounts of the metals that make sustainable energy possible.


Energy Shift
The World’s Biggest Oil Producers in 2023
Just three countries accounted for 40% of global oil production last year.

The World’s Biggest Oil Producers in 2023
This was originally posted on our Voronoi app. Download the app for free on iOS or Android and discover incredible data-driven charts from a variety of trusted sources.
Despite efforts to decarbonize the global economy, oil still remains one of the world’s most important resources. It’s also produced by a fairly limited group of countries, which can be a source of economic and political leverage.
This graphic illustrates global crude oil production in 2023, measured in million barrels per day, sourced from the U.S. Energy Information Administration (EIA).
Three Countries Account for 40% of Global Oil Production
In 2023, the United States, Russia, and Saudi Arabia collectively contributed 32.7 million barrels per day to global oil production.
| Oil Production 2023 | Million barrels per day |
|---|---|
| 🇺🇸 U.S. | 12.9 |
| 🇷🇺 Russia | 10.1 |
| 🇸🇦 Saudi Arabia | 9.7 |
| 🇨🇦 Canada | 4.6 |
| 🇮🇶 Iraq | 4.3 |
| 🇨🇳 China | 4.2 |
| 🇮🇷 Iran | 3.6 |
| 🇧🇷 Brazil | 3.4 |
| 🇦🇪 UAE | 3.4 |
| 🇰🇼 Kuwait | 2.7 |
| 🌍 Other | 22.8 |
These three nations have consistently dominated oil production since 1971. The leading position, however, has alternated among them over the past five decades.
In contrast, the combined production of the next three largest producers—Canada, Iraq, and China—reached 13.1 million barrels per day in 2023, just surpassing the production of the United States alone.
In the near term, no country is likely to surpass the record production achieved by the U.S. in 2023, as no other producer has ever reached a daily capacity of 13.0 million barrels. Recently, Saudi Arabia’s state-owned Saudi Aramco scrapped plans to increase production capacity to 13.0 million barrels per day by 2027.
In 2024, analysts forecast that the U.S. will maintain its position as the top oil producer. In fact, according to Macquarie Group, U.S. oil production is expected to achieve a record pace of about 14 million barrels per day by the end of the year.
Energy Shift
How Much Does the U.S. Depend on Russian Uranium?
Despite a new uranium ban being discussed in Congress, the U.S. is still heavily dependent on Russian uranium.

How Much Does the U.S. Depend on Russian Uranium?
This was originally posted on our Voronoi app. Download the app for free on iOS or Android and discover incredible data-driven charts from a variety of trusted sources.
The U.S. House of Representatives recently passed a ban on imports of Russian uranium. The bill must pass the Senate before becoming law.
In this graphic, we visualize how much the U.S. relies on Russian uranium, based on data from the United States Energy Information Administration (EIA).
U.S. Suppliers of Enriched Uranium
After Russia invaded Ukraine, the U.S. imposed sanctions on Russian-produced oil and gas—yet Russian-enriched uranium is still being imported.
Currently, Russia is the largest foreign supplier of nuclear power fuel to the United States. In 2022, Russia supplied almost a quarter of the enriched uranium used to fuel America’s fleet of more than 90 commercial reactors.
| Country of enrichment service | SWU* | % |
|---|---|---|
| 🇺🇸 United States | 3,876 | 27.34% |
| 🇷🇺 Russia | 3,409 | 24.04% |
| 🇩🇪 Germany | 1,763 | 12.40% |
| 🇬🇧 United Kingdom | 1,593 | 11.23% |
| 🇳🇱 Netherlands | 1,303 | 9.20% |
| Other | 2,232 | 15.79% |
| Total | 14,176 | 100% |
SWU stands for “Separative Work Unit” in the uranium industry. It is a measure of the amount of work required to separate isotopes of uranium during the enrichment process. Source: U.S. Energy Information Administration
Most of the remaining uranium is imported from European countries, while another portion is produced by a British-Dutch-German consortium operating in the United States called Urenco.
Similarly, nearly a dozen countries around the world depend on Russia for more than half of their enriched uranium—and many of them are NATO-allied members and allies of Ukraine.
In 2023 alone, the U.S. nuclear industry paid over $800 million to Russia’s state-owned nuclear energy corporation, Rosatom, and its fuel subsidiaries.
It is important to note that 19% of electricity in the U.S. is powered by nuclear plants.
The dependency on Russian fuels dates back to the 1990s when the United States turned away from its own enrichment capabilities in favor of using down-blended stocks of Soviet-era weapons-grade uranium.
As part of the new uranium-ban bill, the Biden administration plans to allocate $2.2 billion for the expansion of uranium enrichment facilities in the United States.

-

 Electrification3 years ago
Ranked: The Top 10 EV Battery Manufacturers
-

 Electrification2 years ago
The Key Minerals in an EV Battery
-

 Real Assets2 years ago
The World’s Top 10 Gold Mining Companies
-

 Misc3 years ago
All the Metals We Mined in One Visualization
-

 Electrification3 years ago
The Biggest Mining Companies in the World in 2021
-

 Energy Shift2 years ago
What Are the Five Major Types of Renewable Energy?
-

 Electrification2 years ago
The World’s Largest Nickel Mining Companies
-

 Electrification2 years ago
Mapped: Solar Power by Country in 2021