

Real Assets
Which Countries Have the Lowest Inflation?
Which Countries Have the Lowest Inflation?
Investors are bracing for longer inflation.
The Federal Reserve indicated that more restrictive monetary policy is in the cards amid strong employment gains. In Europe, while inflation has fallen, it is still far above the 2% target. Across the Euro area inflation is estimated to have reached 8.5% in January.
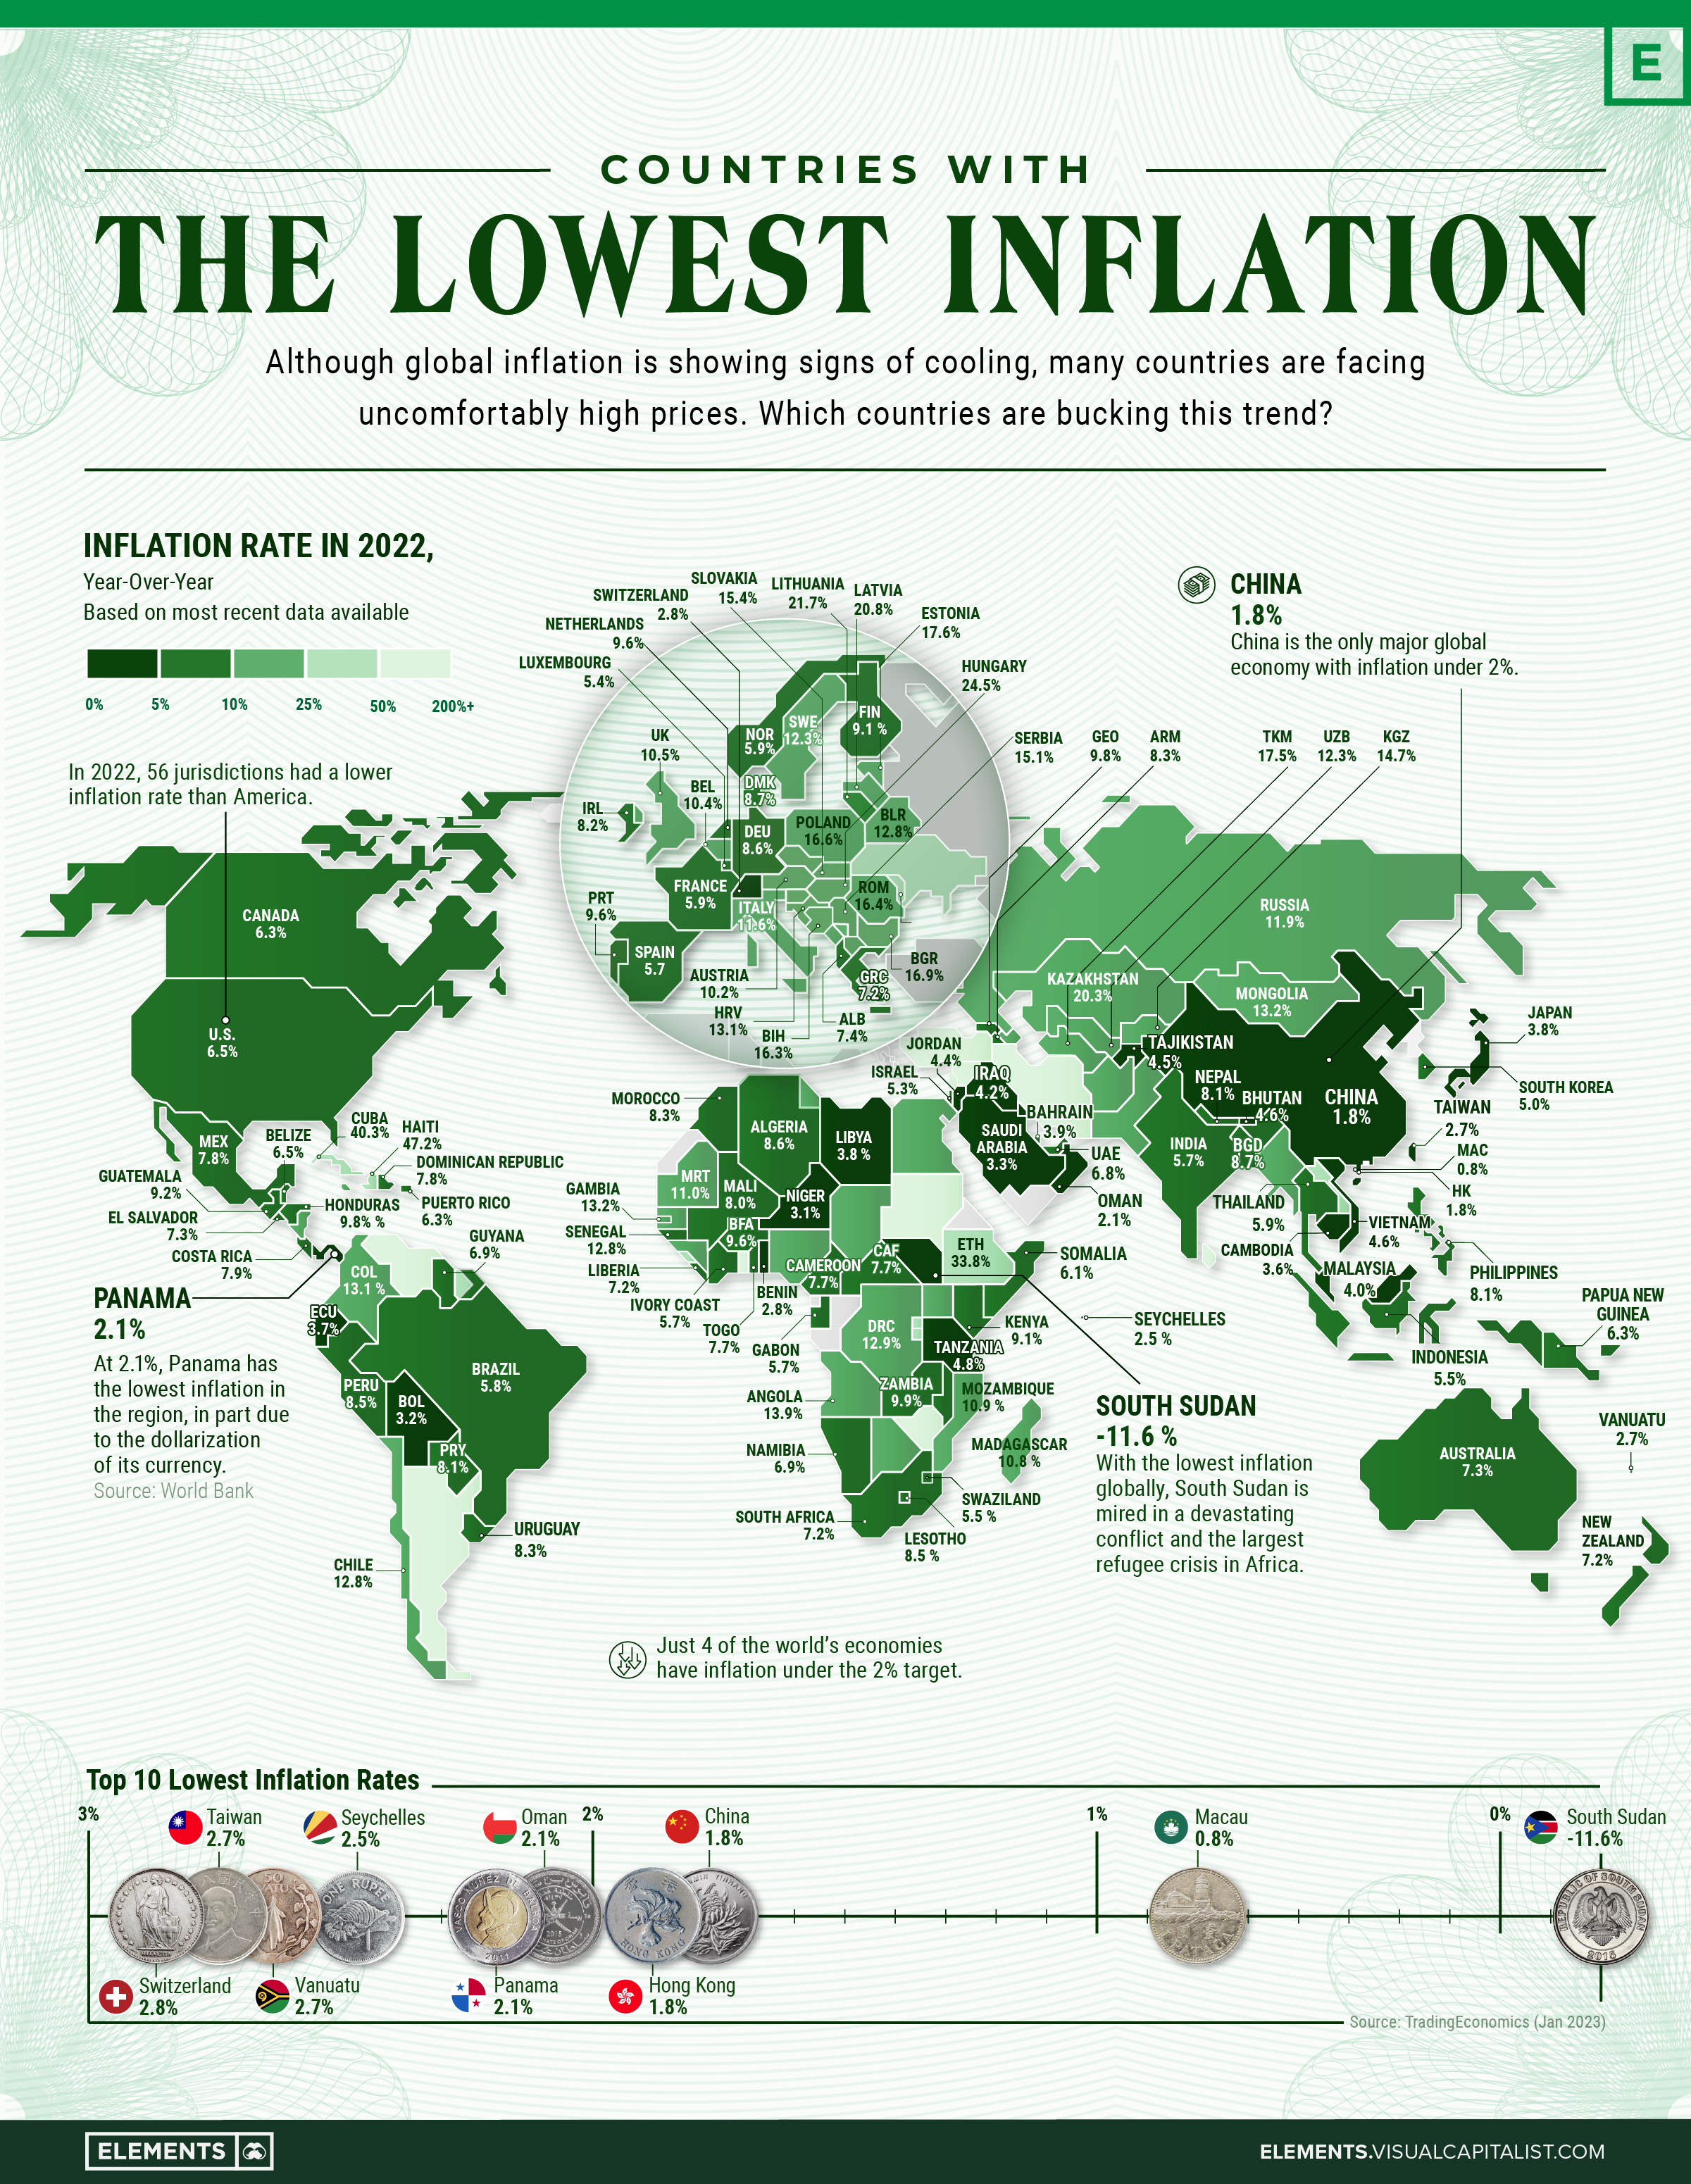
At the same time, some countries have managed to tamp down inflation. Slower growth, cheaper import costs, and foreign exchange policy are some of the factors keeping inflation subdued.
As price pressures rattle global markets, the above infographic maps inflation rates globally using data from Trading Economics, focusing in on the countries with the lowest inflation levels.
World’s Lowest Inflation Rates
Many of the lowest inflation rates around the world are located in Asia, including Macau, China, Hong Kong, and Taiwan. In this region, widespread lockdowns strained growth and consumer spending, lessening inflationary pressures. Last year, Chinese consumers saved $2.2 trillion in bank deposits during these restrictions which were lifted earlier this year.
Inflation in the region was impacted by several other factors. Earlier on in the pandemic, Asian countries including China were less impacted by rising food costs, services inflation, and supply-chain disruptions, unlike what was seen in North America and Europe.
But now as China has reopened, some signs of inflation are beginning to appear. Food prices are up 4.8% annually in December, and hotel rates are rising.
| Rank | Country / Region | Inflation Rate, Year-Over-Year | Date |
|---|---|---|---|
| 1 | 🇸🇸 South Sudan | -11.6% | Dec 2022 |
| 2 | 🇲🇴 Macau | 0.8% | Nov 2022 |
| 3 | 🇨🇳 China | 1.8% | Dec 2022 |
| 4 | 🇭🇰 Hong Kong SAR | 1.8% | Nov 2022 |
| 5 | 🇴🇲 Oman | 2.1% | Nov 2022 |
| 6 | 🇵🇦 Panama | 2.1% | Dec 2022 |
| 7 | 🇸🇨 Seychelles | 2.5% | Dec 2022 |
| 8 | 🇻🇺 Vanuatu | 2.7% | Mar 2022 |
| 9 | 🇹🇼 Taiwan | 2.7% | Dec 2022 |
| 10 | 🇨🇭 Switzerland | 2.8% | Dec 2022 |
| 11 | 🇱🇮 Liechtenstein | 2.8% | Dec 2022 |
| 12 | 🇧🇯 Benin | 2.8% | Dec 2022 |
| 13 | 🇲🇻 Maldives | 2.8% | Nov 2022 |
| 14 | 🇳🇪 Niger | 3.1% | Dec 2022 |
| 15 | 🇧🇳 Brunei | 3.1% | Nov 2022 |
| 16 | 🇧🇴 Bolivia | 3.2% | Nov 2022 |
| 17 | 🇰🇼 Kuwait | 3.2% | Nov 2022 |
| 18 | 🇸🇦 Saudi Arabia | 3.3% | Dec 2022 |
| 19 | 🇰🇭 Cambodia | 3.6% | Oct 2022 |
| 20 | 🇫🇯 Fiji | 3.6% | Dec 2022 |
| 21 | 🇪🇨 Ecuador | 3.7% | Dec 2022 |
| 22 | 🇯🇵 Japan | 3.8% | Nov 2022 |
| 23 | 🇱🇾 Libya | 3.8% | Nov 2022 |
| 24 | 🇧🇲 Bermuda | 3.8% | Oct 2022 |
| 25 | 🇧🇭 Bahrain | 3.9% | Nov 2022 |
| 26 | 🇲🇾 Malaysia | 4.0% | Nov 2022 |
| 27 | 🇵🇸 Palestine | 4.1% | Dec 2022 |
| 28 | 🇮🇶 Iraq | 4.2% | Nov 2022 |
| 29 | 🇯🇴 Jordan | 4.4% | Dec 2022 |
| 30 | 🇹🇯 Tajikistan | 4.5% | Nov 2022 |
| 31 | 🇻🇳 Vietnam | 4.6% | Dec 2022 |
| 32 | 🇧🇹 Bhutan | 4.6% | Nov 2022 |
| 33 | 🇹🇿 Tanzania | 4.8% | Dec 2022 |
| 34 | 🇳🇨 New Caledonia | 4.9% | Dec 2022 |
| 35 | 🇰🇷 South Korea | 5.0% | Dec 2022 |
| 36 | 🇮🇱 Israel | 5.3% | Dec 2022 |
| 37 | 🇱🇺 Luxembourg | 5.4% | Dec 2022 |
| 38 | 🇸🇿 Swaziland | 5.5% | Oct 2022 |
| 39 | 🇮🇩 Indonesia | 5.5% | Dec 2022 |
| 40 | 🇬🇦 Gabon | 5.7% | Oct 2022 |
| 41 | 🇨🇮 Ivory Coast | 5.7% | Nov 2022 |
| 42 | 🇪🇸 Spain | 5.7% | Dec 2022 |
| 43 | 🇮🇳 India | 5.7% | Dec 2022 |
| 44 | 🇧🇷 Brazil | 5.8% | Dec 2022 |
| 45 | 🇹🇭 Thailand | 5.9% | Dec 2022 |
| 46 | 🇫🇷 France | 5.9% | Dec 2022 |
| 47 | 🇳🇴 Norway | 5.9% | Dec 2022 |
| 48 | 🇶🇦 Qatar | 5.9% | Dec 2022 |
| 49 | 🇩🇯 Djibouti | 6.1% | Sep 2022 |
| 50 | 🇸🇴 Somalia | 6.1% | Dec 2022 |
| 51 | 🇹🇹 Trinidad and Tobago | 6.2% | Sep 2022 |
| 52 | 🇵🇬 Papua New Guinea | 6.3% | Sep 2022 |
| 53 | 🇵🇷 Puerto Rico | 6.3% | Nov 2022 |
| 54 | 🇨🇦 Canada | 6.3% | Dec 2022 |
| 55 | 🇧🇸 Bahamas | 6.5% | Sep/22 |
| 56 | 🇧🇿 Belize | 6.5% | Nov 2022 |
| 57 | 🇺🇸 U.S. | 6.5% | Dec 2022 |
| 58 | 🇦🇼 Aruba | 6.6% | Nov 2022 |
| 59 | 🇸🇬 Singapore | 6.7% | Nov 2022 |
| 60 | 🇹🇱 East Timor | 6.7% | Nov 2022 |
| 61 | 🇦🇪 UAE | 6.8% | Jun 2022 |
| 62 | 🇳🇦 Namibia | 6.9% | Dec 2022 |
| 63 | 🇬🇾 Guyana | 6.9% | Nov 2022 |
| 64 | 🇳🇿 New Zealand | 7.2% | Sep 2022 |
| 65 | 🇿🇦 South Africa | 7.2% | Dec 2022 |
| 66 | 🇬🇷 Greece | 7.2% | Dec 2022 |
| 67 | 🇱🇷 Liberia | 7.2% | Sep 2022 |
| 68 | 🇦🇺 Australia | 7.3% | Sep 2022 |
| 69 | 🇲🇹 Malta | 7.3% | Dec 2022 |
| 70 | 🇸🇻 El Salvador | 7.3% | Dec 2022 |
| 71 | 🇦🇱 Albania | 7.4% | Dec 2022 |
| 72 | 🇨🇻 Cape Verde | 7.6% | Dec 2022 |
| 73 | 🇨🇲 Cameroon | 7.7% | Sep 2022 |
| 74 | 🇨🇫 Central African Republic | 7.7% | Nov 2022 |
| 75 | 🇹🇬 Togo | 7.7% | Dec 2022 |
| 76 | 🇲🇽 Mexico | 7.8% | Dec 2022 |
| 77 | 🇩🇴 Dominican Republic | 7.8% | Dec 2022 |
| 78 | 🇨🇷 Costa Rica | 7.9% | Dec 2022 |
| 79 | 🇨🇾 Cyprus | 7.9% | Dec 2022 |
| 80 | 🇲🇱 Mali | 8.0% | Nov 2022 |
| 81 | 🇳🇵 Nepal | 8.1% | Nov 2022 |
| 82 | 🇵🇭 Philippines | 8.1% | Dec 2022 |
| 83 | 🇵🇾 Paraguay | 8.1% | Dec 2022 |
| 84 | 🇧🇧 Barbados | 8.2% | Oct 2022 |
| 85 | 🇮🇪 Ireland | 8.2% | Dec 2022 |
| 86 | 🇺🇾 Uruguay | 8.3% | Dec 2022 |
| 87 | 🇲🇦 Morocco | 8.3% | Nov 2022 |
| 88 | 🇦🇲 Armenia | 8.3% | Dec 2022 |
| 89 | 🇵🇪 Peru | 8.5% | Dec 2022 |
| 90 | 🇱🇸 Lesotho | 8.5% | Oct 2022 |
| 91 | 🇩🇿 Algeria | 8.6% | Nov 2022 |
| 92 | 🇩🇪 Germany | 8.6% | Dec 2022 |
| 93 | 🇩🇰 Denmark | 8.7% | Dec 2022 |
| 94 | 🇧🇩 Bangladesh | 8.7% | Dec 2022 |
| 95 | 🇫🇴 Faroe Islands | 8.8% | Sep 2022 |
| 96 | 🇫🇮 Finland | 9.1% | Dec 2022 |
| 97 | 🇰🇪 Kenya | 9.1% | Dec 2022 |
| 98 | 🇰🇾 Cayman Islands | 9.2% | Sep 2022 |
| 99 | 🇬🇹 Guatemala | 9.2% | Dec 2022 |
| 100 | 🇬🇼 Guinea Bissau | 9.4% | Nov 2022 |
*Inflation rates based on latest available data.
Globally, one outlier is South Sudan. Political instability and violence have depressed growth and inflation, which stood at -11.6% in December. As it faces a severe humanitarian crisis, the country has the lowest inflation rate worldwide.
Oil-producing nation Oman has also seen low inflation, at 2.1%. One reason for this is that the Omani rial is pegged to the U.S. dollar, keeping the currency anchored. Inflation has remained moderate over the last decade in the country.
The Country With the Lowest Inflation, by Region
In Europe, Switzerland has the lowest inflation rate, at 2.8%, or roughly one-third of the Euro area’s. It is also the lowest rate in the OECD. The country’s strong currency has shielded it from inflationary pressures and high import prices.
Meanwhile, Swiss production prices have risen marginally above inflation, to 4.1% annually in mid-2022. Last year, the Swiss central bank raised interest rates for the first time since 2007 from -0.75% to -0.25% following 20 years of deflation.
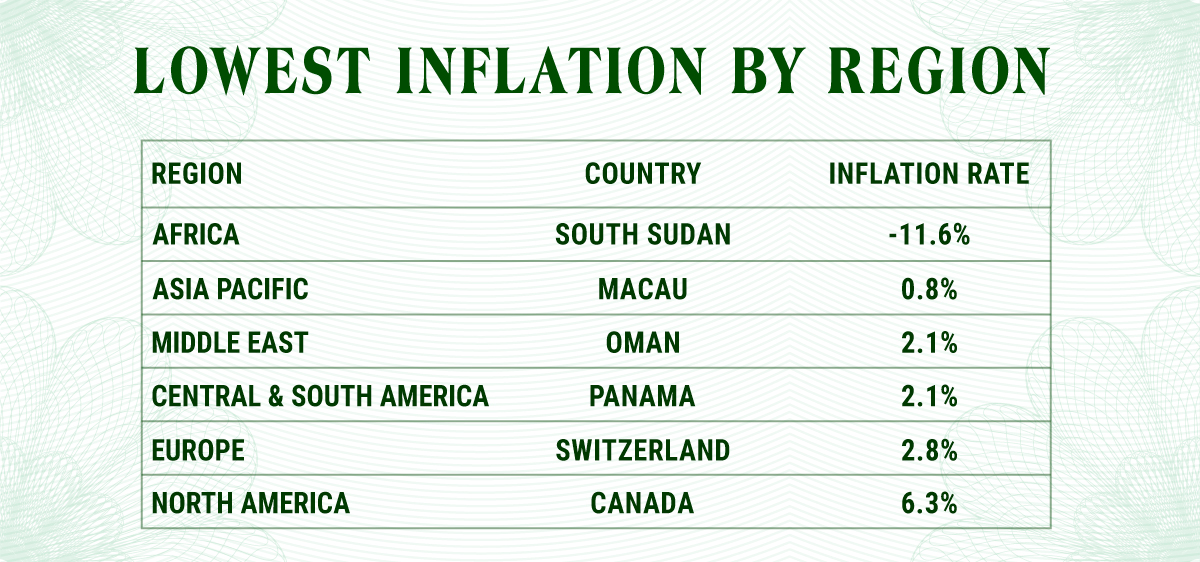
Panama has the lowest rate in Latin America. The dollarization of the Panamanian balboa has helped quash price pressures. In July, the government regulated the price of 72 items to keep the cost of living from rising after three weeks of protests as inflation climbed as high as 5.2% during the course of 2022.
With the lowest inflation in Asia, Macau witnessed the tourism industry fall off a cliff given lockdown measures, and the economy saw both its GDP and inflation collapse in 2022. Its real GDP is projected to have fallen close to 30% for the year.
Future Gazing
The IMF estimates that 84% of countries around the world will have lower inflation than last year. By 2024, both headline and core inflation are projected to remain above pre-pandemic levels at 4.1%.
Opposing forces of China’s reopening and weaker global growth could offset inflationary pressures, yet this interplay—among a host of other factors—remains to be seen.


Real Assets
Charted: The Value Gap Between the Gold Price and Gold Miners
While gold prices hit all-time highs, gold mining stocks have lagged far behind.

Gold Price vs. Gold Mining Stocks
This was originally posted on our Voronoi app. Download the app for free on Apple or Android and discover incredible data-driven charts from a variety of trusted sources.
Although the price of gold has reached new record highs in 2024, gold miners are still far from their 2011 peaks.
In this graphic, we illustrate the evolution of gold prices since 2000 compared to the NYSE Arca Gold BUGS Index (HUI), which consists of the largest and most widely held public gold production companies. The data was compiled by Incrementum AG.
Mining Stocks Lag Far Behind
In April 2024, gold reached a new record high as Federal Reserve Chair Jerome Powell signaled policymakers may delay interest rate cuts until clearer signs of declining inflation materialize.
Additionally, with elections occurring in more than 60 countries in 2024 and ongoing conflicts in Ukraine and Gaza, central banks are continuing to buy gold to strengthen their reserves, creating momentum for the metal.
Traditionally known as a hedge against inflation and a safe haven during times of political and economic uncertainty, gold has climbed over 11% so far this year.
According to Business Insider, gold miners experienced their best performance in a year in March 2024. During that month, the gold mining sector outperformed all other U.S. industries, surpassing even the performance of semiconductor stocks.
Still, physical gold has outperformed shares of gold-mining companies over the past three years by one of the largest margins in decades.
| Year | Gold Price | NYSE Arca Gold BUGS Index (HUI) |
|---|---|---|
| 2023 | $2,062.92 | $243.31 |
| 2022 | $1,824.32 | $229.75 |
| 2021 | $1,828.60 | $258.87 |
| 2020 | $1,895.10 | $299.64 |
| 2019 | $1,523.00 | $241.94 |
| 2018 | $1,281.65 | $160.58 |
| 2017 | $1,296.50 | $192.31 |
| 2016 | $1,151.70 | $182.31 |
| 2015 | $1,060.20 | $111.18 |
| 2014 | $1,199.25 | $164.03 |
| 2013 | $1,201.50 | $197.70 |
| 2012 | $1,664.00 | $444.22 |
| 2011 | $1,574.50 | $498.73 |
| 2010 | $1,410.25 | $573.32 |
| 2009 | $1,104.00 | $429.91 |
| 2008 | $865.00 | $302.41 |
| 2007 | $836.50 | $409.37 |
| 2006 | $635.70 | $338.24 |
| 2005 | $513.00 | $276.90 |
| 2004 | $438.00 | $215.33 |
| 2003 | $417.25 | $242.93 |
| 2002 | $342.75 | $145.12 |
| 2001 | $276.50 | $65.20 |
| 2000 | $272.65 | $40.97 |
Among the largest companies on the NYSE Arca Gold BUGS Index, Colorado-based Newmont has experienced a 24% drop in its share price over the past year. Similarly, Canadian Barrick Gold also saw a decline of 6.5% over the past 12 months.
Real Assets
200 Years of Global Gold Production, by Country
Global gold production has grown exponentially since the 1800s, with 86% of all above-ground gold mined in the last 200 years.


Visualizing Global Gold Production Over 200 Years
Although the practice of gold mining has been around for thousands of years, it’s estimated that roughly 86% of all above-ground gold was extracted in the last 200 years.
With modern mining techniques making large-scale production possible, global gold production has grown exponentially since the 1800s.
The above infographic uses data from Our World in Data to visualize global gold production by country from 1820 to 2022, showing how gold mining has evolved to become increasingly global over time.
A Brief History of Gold Mining
The best-known gold rush in modern history occurred in California in 1848, when James Marshall discovered gold in Sacramento Valley. As word spread, thousands of migrants flocked to California in search of gold, and by 1855, miners had extracted around $2 billion worth of gold.
The United States, Australia, and Russia were (interchangeably) the three largest gold producers until the 1890s. Then, South Africa took the helm thanks to the massive discovery in the Witwatersrand Basin, now regarded today as one of the world’s greatest ever goldfields.
South Africa’s annual gold production peaked in 1970 at 1,002 tonnes—by far the largest amount of gold produced by any country in a year.
With the price of gold rising since the 1980s, global gold production has become increasingly widespread. By 2007, China was the world’s largest gold-producing nation, and today a significant quantity of gold is being mined in over 40 countries.
The Top Gold-Producing Countries in 2022
Around 31% of the world’s gold production in 2022 came from three countries—China, Russia, and Australia, with each producing over 300 tonnes of the precious metal.
| Rank | Country | 2022E Gold Production, tonnes | % of Total |
|---|---|---|---|
| #1 | 🇨🇳 China | 330 | 11% |
| #2 | 🇷🇺 Russia | 320 | 10% |
| #3 | 🇦🇺 Australia | 320 | 10% |
| #4 | 🇨🇦 Canada | 220 | 7% |
| #5 | 🇺🇸 United States | 170 | 5% |
| #6 | 🇲🇽 Mexico | 120 | 4% |
| #7 | 🇰🇿 Kazakhstan | 120 | 4% |
| #8 | 🇿🇦 South Africa | 110 | 4% |
| #9 | 🇵🇪 Peru | 100 | 3% |
| #10 | 🇺🇿 Uzbekistan | 100 | 3% |
| #11 | 🇬🇭 Ghana | 90 | 3% |
| #12 | 🇮🇩 Indonesia | 70 | 2% |
| - | 🌍 Rest of the World | 1,030 | 33% |
| - | World Total | 3,100 | 100% |
North American countries Canada, the U.S., and Mexico round out the top six gold producers, collectively making up 16% of the global total. The state of Nevada alone accounted for 72% of U.S. production, hosting the world’s largest gold mining complex (including six mines) owned by Nevada Gold Mines.
Meanwhile, South Africa produced 110 tonnes of gold in 2022, down by 74% relative to its output of 430 tonnes in 2000. This long-term decline is the result of mine closures, maturing assets, and industrial conflict, according to the World Gold Council.
Interestingly, two smaller gold producers on the list, Uzbekistan and Indonesia, host the second and third-largest gold mining operations in the world, respectively.
The Outlook for Global Gold Production
As of April 25, gold prices were hovering around the $2,000 per ounce mark and nearing all-time highs. For mining companies, higher gold prices can mean more profits per ounce if costs remain unaffected.
According to the World Gold Council, mined gold production is expected to increase in 2023 and could surpass the record set in 2018 (3,300 tonnes), led by the expansion of existing projects in North America. The chances of record mine output could be higher if gold prices continue to increase.

-

 Electrification3 years ago
Ranked: The Top 10 EV Battery Manufacturers
-

 Electrification2 years ago
The Key Minerals in an EV Battery
-

 Real Assets2 years ago
The World’s Top 10 Gold Mining Companies
-

 Misc3 years ago
All the Metals We Mined in One Visualization
-

 Electrification3 years ago
The Biggest Mining Companies in the World in 2021
-

 Energy Shift2 years ago
What Are the Five Major Types of Renewable Energy?
-

 Electrification2 years ago
The World’s Largest Nickel Mining Companies
-

 Electrification2 years ago
Mapped: Solar Power by Country in 2021