

Real Assets
What is a Commodity Super Cycle?
Visualizing the Commodity Super Cycle
Since the beginning of the Industrial Revolution, the world has seen its population and the need for natural resources boom.
As more people and wealth translate into the demand for global goods, the prices of commodities—such as energy, agriculture, livestock, and metals—have often followed in sync.
This cycle, which tends to coincide with extended periods of industrialization and modernization, helps in telling a story of human development.
Why are Commodity Prices Cyclical?
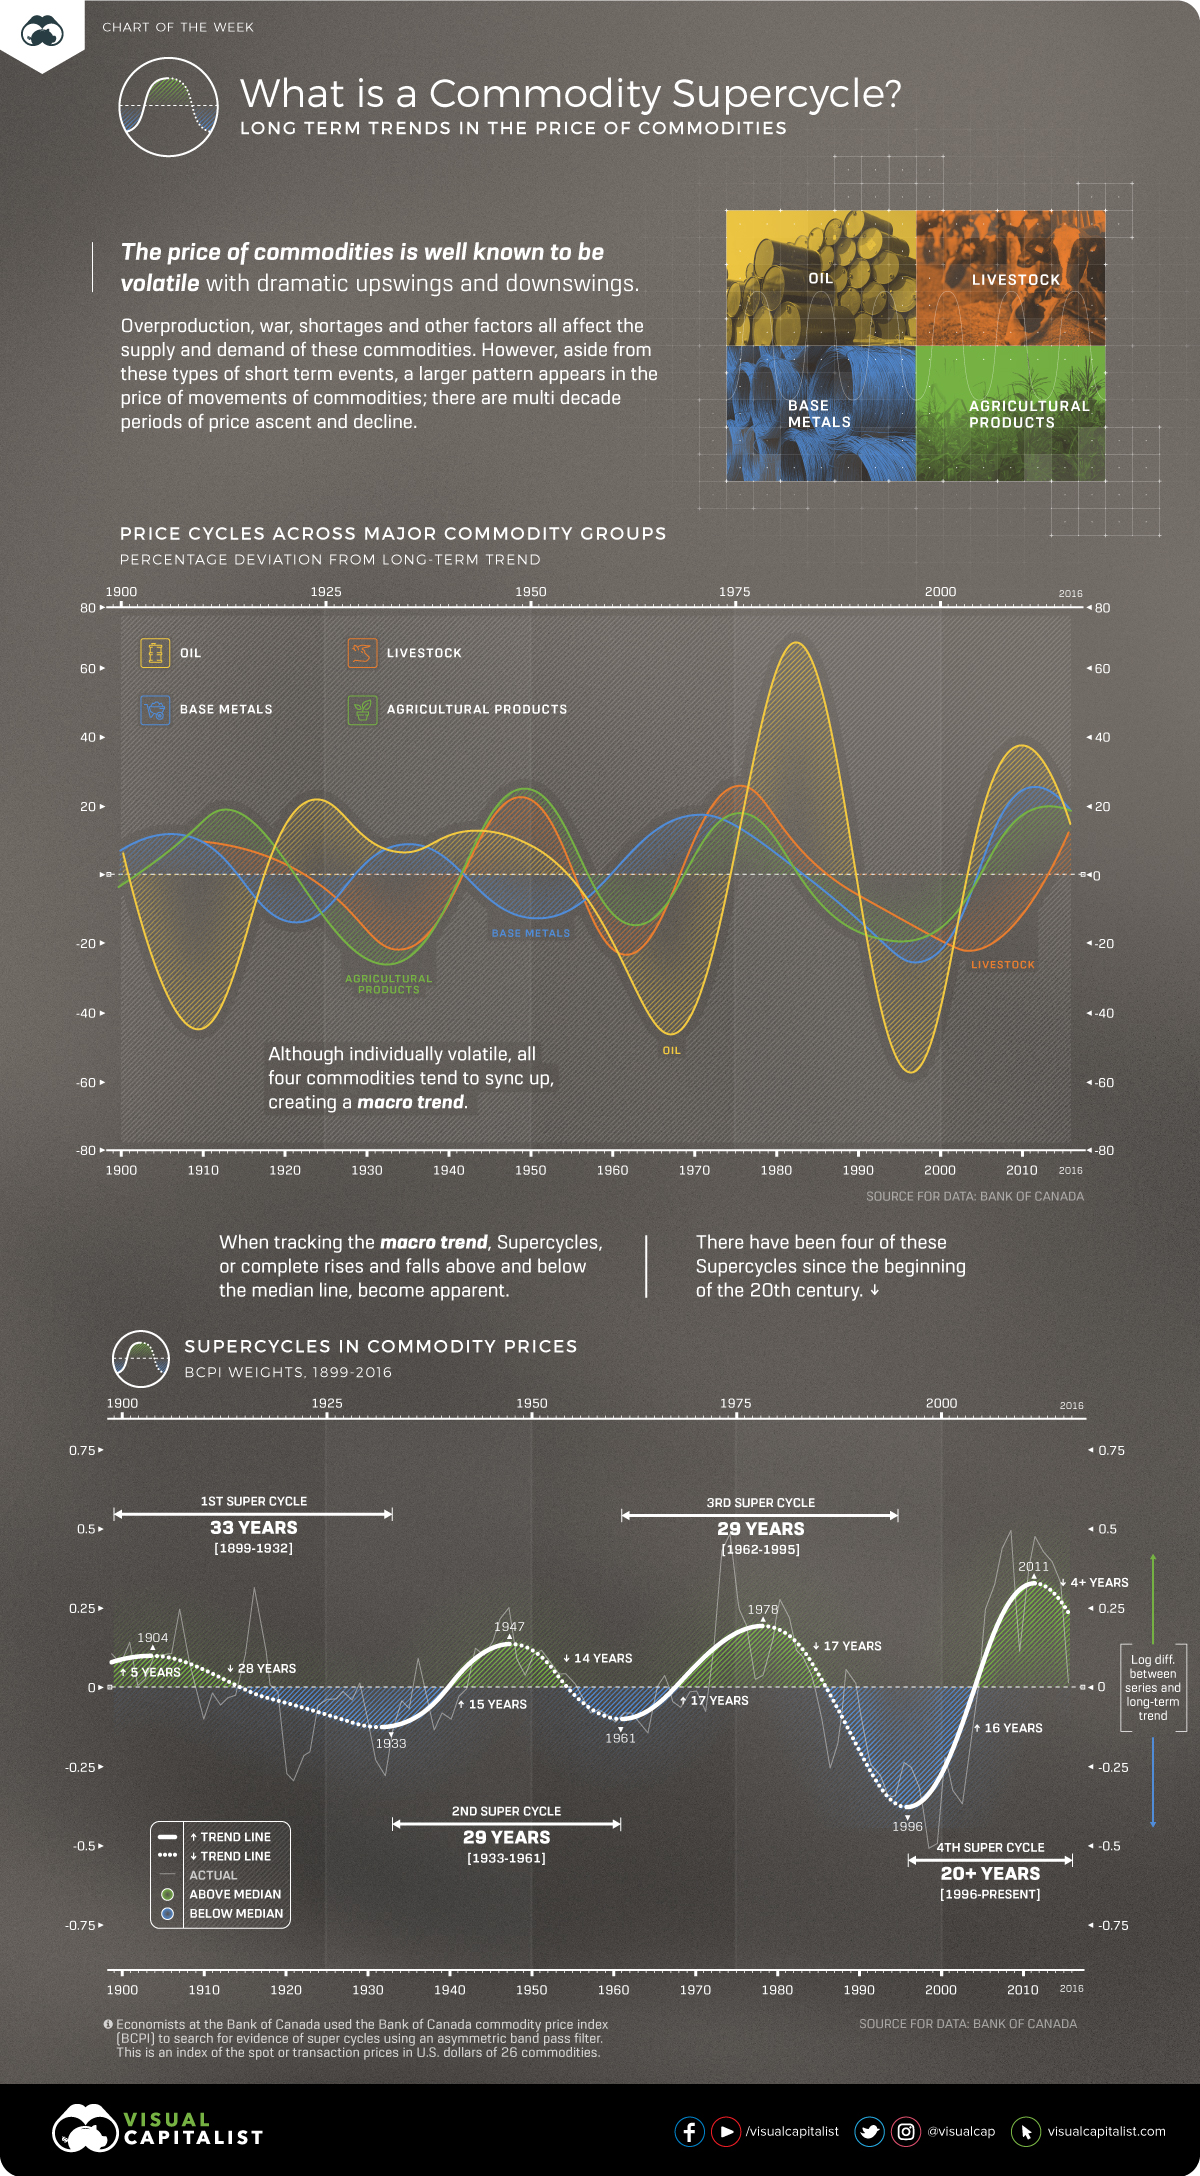
Commodity prices go through extended periods during which prices are well above or below their long-term price trend. There are two types of swings in commodity prices: upswings and downswings.
Many economists believe that the upswing phase in super cycles results from a lag between unexpected, persistent, and positive trends to support commodity demand with slow-moving supply, such as the building of a new mine or planting a new crop. Eventually, as adequate supply becomes available and demand growth slows, the cycle enters a downswing phase.
While individual commodity groups have their own price patterns, when charted together they form extended periods of price trends known as “Commodity Super Cycles” where there is a recognizable pattern across major commodity groups.
How can a Commodity Super Cycle be Identified?
Commodity super cycles are different from immediate supply disruptions; high or low prices persist over time.
In our above chart, we used data from the Bank of Canada, who leveraged a statistical technique called an asymmetric band pass filter. This is a calculation that can identify the patterns or frequencies of events in sets of data.
Economists at the Bank of Canada employed this technique using their Commodity Price Index (BCPI) to search for evidence of super cycles. This is an index of the spot or transaction prices in U.S. dollars of 26 commodities produced in Canada and sold to world markets.
- Energy: Coal, Oil, Natural Gas
- Metals and Minerals: Gold, Silver, Nickel, Copper, Aluminum, Zinc, Potash, Lead, Iron
- Forestry: Pulp, Lumber, Newsprint
- Agriculture: Potatoes, Cattle, Hogs, Wheat, Barley, Canola, Corn
- Fisheries: Finfish, Shellfish
Using the band pass filter and the BCPI data, the chart indicates that there are four distinct commodity price super cycles since 1899.
- 1899-1932:
The first cycle coincides with the industrialization of the United States in the late 19th century. - 1933-1961:
The second began with the onset of global rearmament before the Second World War in the 1930s. - 1962-1995:
The third began with the reindustrialization of Europe and Japan in the late 1950s and early 1960s. - 1996 – Present:
The fourth began in the mid to late 1990s with the rapid industrialization of China
What Causes Commodity Cycles?
The rapid industrialization and growth of a nation or region are the main drivers of these commodity super cycles.
From the rapid industrialization of America emerging as a world power at the beginning of the 20th century, to the ascent of China at the beginning of the 21st century, these historical periods of growth and industrialization drive new demand for commodities.
Because there is often a lag in supply coming online, prices have nowhere to go but above long-term trend lines. Then, prices cannot subside until supply is overshot, or growth slows down.
Is This the Beginning of a New Super Cycle?
The evidence suggests that human industrialization drives commodity prices into cycles. However, past growth was asymmetric around the world with different countries taking the lion’s share of commodities at different times.
With more and more parts of the world experiencing growth simultaneously, demand for commodities is not isolated to a few nations.
Confined to Earth, we could possibly be entering an era where commodities could perpetually be scarce and valuable, breaking the cycles and giving power to nations with the greatest access to resources.
Each commodity has its own story, but together, they show the arc of human development.


Real Assets
Charted: The Value Gap Between the Gold Price and Gold Miners
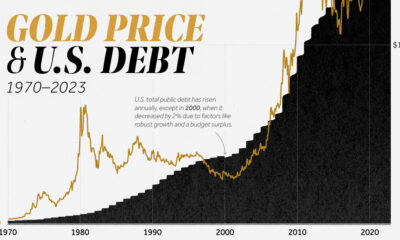
While gold prices hit all-time highs, gold mining stocks have lagged far behind.

Gold Price vs. Gold Mining Stocks
This was originally posted on our Voronoi app. Download the app for free on Apple or Android and discover incredible data-driven charts from a variety of trusted sources.
Although the price of gold has reached new record highs in 2024, gold miners are still far from their 2011 peaks.
In this graphic, we illustrate the evolution of gold prices since 2000 compared to the NYSE Arca Gold BUGS Index (HUI), which consists of the largest and most widely held public gold production companies. The data was compiled by Incrementum AG.
Mining Stocks Lag Far Behind
In April 2024, gold reached a new record high as Federal Reserve Chair Jerome Powell signaled policymakers may delay interest rate cuts until clearer signs of declining inflation materialize.
Additionally, with elections occurring in more than 60 countries in 2024 and ongoing conflicts in Ukraine and Gaza, central banks are continuing to buy gold to strengthen their reserves, creating momentum for the metal.
Traditionally known as a hedge against inflation and a safe haven during times of political and economic uncertainty, gold has climbed over 11% so far this year.
According to Business Insider, gold miners experienced their best performance in a year in March 2024. During that month, the gold mining sector outperformed all other U.S. industries, surpassing even the performance of semiconductor stocks.
Still, physical gold has outperformed shares of gold-mining companies over the past three years by one of the largest margins in decades.
| Year | Gold Price | NYSE Arca Gold BUGS Index (HUI) |
|---|---|---|
| 2023 | $2,062.92 | $243.31 |
| 2022 | $1,824.32 | $229.75 |
| 2021 | $1,828.60 | $258.87 |
| 2020 | $1,895.10 | $299.64 |
| 2019 | $1,523.00 | $241.94 |
| 2018 | $1,281.65 | $160.58 |
| 2017 | $1,296.50 | $192.31 |
| 2016 | $1,151.70 | $182.31 |
| 2015 | $1,060.20 | $111.18 |
| 2014 | $1,199.25 | $164.03 |
| 2013 | $1,201.50 | $197.70 |
| 2012 | $1,664.00 | $444.22 |
| 2011 | $1,574.50 | $498.73 |
| 2010 | $1,410.25 | $573.32 |
| 2009 | $1,104.00 | $429.91 |
| 2008 | $865.00 | $302.41 |
| 2007 | $836.50 | $409.37 |
| 2006 | $635.70 | $338.24 |
| 2005 | $513.00 | $276.90 |
| 2004 | $438.00 | $215.33 |
| 2003 | $417.25 | $242.93 |
| 2002 | $342.75 | $145.12 |
| 2001 | $276.50 | $65.20 |
| 2000 | $272.65 | $40.97 |
Among the largest companies on the NYSE Arca Gold BUGS Index, Colorado-based Newmont has experienced a 24% drop in its share price over the past year. Similarly, Canadian Barrick Gold also saw a decline of 6.5% over the past 12 months.
Real Assets
200 Years of Global Gold Production, by Country
Global gold production has grown exponentially since the 1800s, with 86% of all above-ground gold mined in the last 200 years.


Visualizing Global Gold Production Over 200 Years
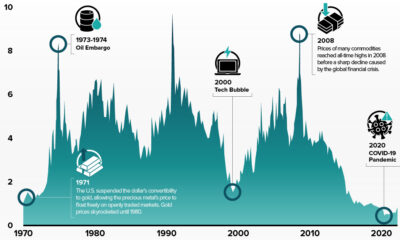
Although the practice of gold mining has been around for thousands of years, it’s estimated that roughly 86% of all above-ground gold was extracted in the last 200 years.
With modern mining techniques making large-scale production possible, global gold production has grown exponentially since the 1800s.
The above infographic uses data from Our World in Data to visualize global gold production by country from 1820 to 2022, showing how gold mining has evolved to become increasingly global over time.
A Brief History of Gold Mining
The best-known gold rush in modern history occurred in California in 1848, when James Marshall discovered gold in Sacramento Valley. As word spread, thousands of migrants flocked to California in search of gold, and by 1855, miners had extracted around $2 billion worth of gold.
The United States, Australia, and Russia were (interchangeably) the three largest gold producers until the 1890s. Then, South Africa took the helm thanks to the massive discovery in the Witwatersrand Basin, now regarded today as one of the world’s greatest ever goldfields.
South Africa’s annual gold production peaked in 1970 at 1,002 tonnes—by far the largest amount of gold produced by any country in a year.
With the price of gold rising since the 1980s, global gold production has become increasingly widespread. By 2007, China was the world’s largest gold-producing nation, and today a significant quantity of gold is being mined in over 40 countries.
The Top Gold-Producing Countries in 2022
Around 31% of the world’s gold production in 2022 came from three countries—China, Russia, and Australia, with each producing over 300 tonnes of the precious metal.
| Rank | Country | 2022E Gold Production, tonnes | % of Total |
|---|---|---|---|
| #1 | 🇨🇳 China | 330 | 11% |
| #2 | 🇷🇺 Russia | 320 | 10% |
| #3 | 🇦🇺 Australia | 320 | 10% |
| #4 | 🇨🇦 Canada | 220 | 7% |
| #5 | 🇺🇸 United States | 170 | 5% |
| #6 | 🇲🇽 Mexico | 120 | 4% |
| #7 | 🇰🇿 Kazakhstan | 120 | 4% |
| #8 | 🇿🇦 South Africa | 110 | 4% |
| #9 | 🇵🇪 Peru | 100 | 3% |
| #10 | 🇺🇿 Uzbekistan | 100 | 3% |
| #11 | 🇬🇭 Ghana | 90 | 3% |
| #12 | 🇮🇩 Indonesia | 70 | 2% |
| - | 🌍 Rest of the World | 1,030 | 33% |
| - | World Total | 3,100 | 100% |
North American countries Canada, the U.S., and Mexico round out the top six gold producers, collectively making up 16% of the global total. The state of Nevada alone accounted for 72% of U.S. production, hosting the world’s largest gold mining complex (including six mines) owned by Nevada Gold Mines.
Meanwhile, South Africa produced 110 tonnes of gold in 2022, down by 74% relative to its output of 430 tonnes in 2000. This long-term decline is the result of mine closures, maturing assets, and industrial conflict, according to the World Gold Council.
Interestingly, two smaller gold producers on the list, Uzbekistan and Indonesia, host the second and third-largest gold mining operations in the world, respectively.
The Outlook for Global Gold Production
As of April 25, gold prices were hovering around the $2,000 per ounce mark and nearing all-time highs. For mining companies, higher gold prices can mean more profits per ounce if costs remain unaffected.
According to the World Gold Council, mined gold production is expected to increase in 2023 and could surpass the record set in 2018 (3,300 tonnes), led by the expansion of existing projects in North America. The chances of record mine output could be higher if gold prices continue to increase.

-

 Electrification3 years ago
Ranked: The Top 10 EV Battery Manufacturers
-

 Electrification2 years ago
The Key Minerals in an EV Battery
-

 Real Assets3 years ago
The World’s Top 10 Gold Mining Companies
-

 Misc3 years ago
All the Metals We Mined in One Visualization
-

 Electrification3 years ago
The Biggest Mining Companies in the World in 2021
-

 Energy Shift2 years ago
What Are the Five Major Types of Renewable Energy?
-

 Electrification2 years ago
Mapped: Solar Power by Country in 2021
-

 Electrification2 years ago
The World’s Largest Nickel Mining Companies