

Energy Shift
Visualizing Nuclear Power Production by Country
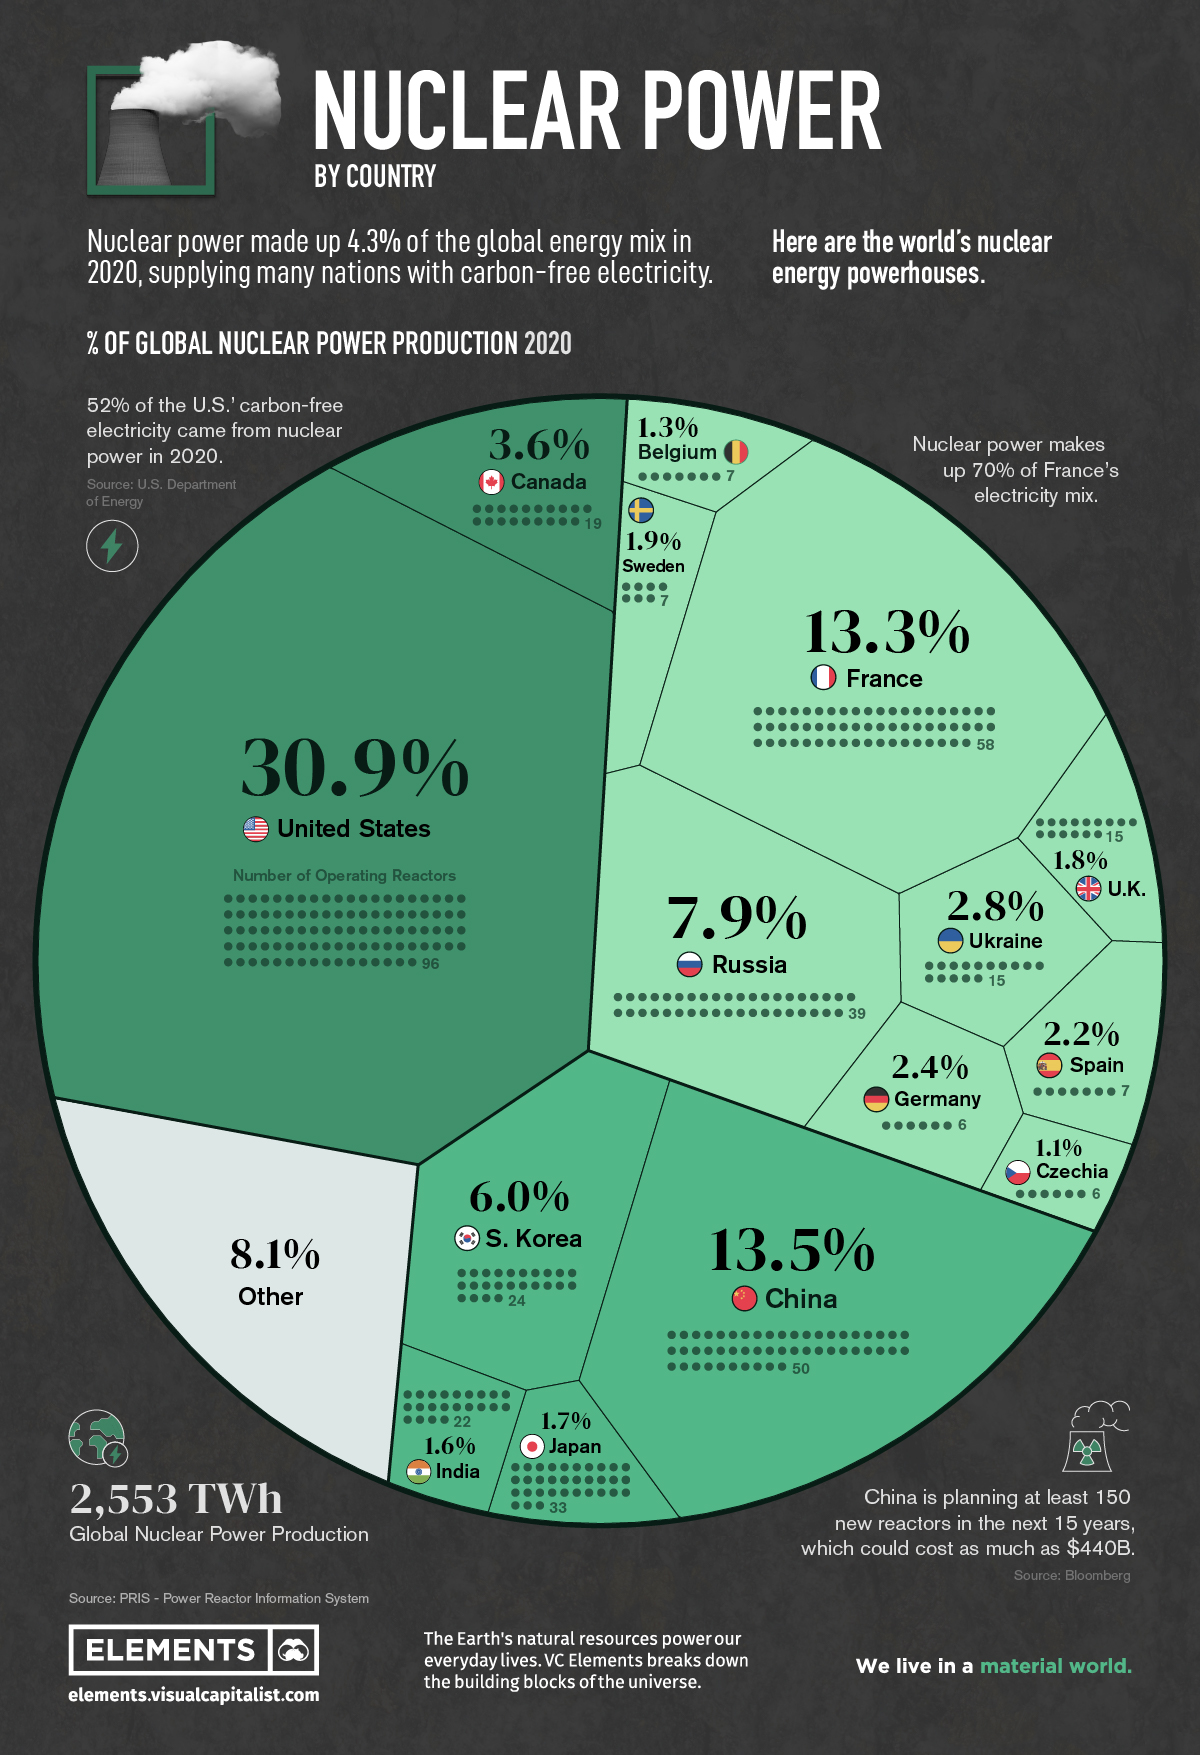
Nuclear Power Production by Country
Nearly 450 reactors around the world supply various nations with nuclear power, combining for about 10% of the world’s electricity, or about 4% of the global energy mix.
But while some countries are turning to nuclear as a clean energy source, nuclear energy generation overall has seen a slowdown since its peak in the 1990s.
The above infographic breaks down nuclear electricity generation by country in 2020 using data from the Power Reactor Information System (PRIS).
Ranked: The Top 15 Countries for Nuclear Power
Just 15 countries account for more than 91% of global nuclear power production. Here’s how much energy these countries produced in 2020:
| Rank | Country | Number of Operating Reactors | Nuclear Electricity Supplied [GWh] | % share |
|---|---|---|---|---|
| #1 | U.S. 🇺🇸 | 96 | 789,919 | 30.9% |
| #2 | China 🇨🇳 | 50 | 344,748 | 13.5% |
| #3 | France 🇫🇷 | 58 | 338,671 | 13.3% |
| #4 | Russia 🇷🇺 | 39 | 201,821 | 7.9% |
| #5 | South Korea 🇰🇷 | 24 | 152,583 | 6.0% |
| #6 | Canada 🇨🇦 | 19 | 92,166 | 3.6% |
| #7 | Ukraine 🇺🇦 | 15 | 71,550 | 2.8% |
| #8 | Germany 🇩🇪 | 6 | 60,918 | 2.4% |
| #9 | Spain 🇪🇸 | 7 | 55,825 | 2.2% |
| #10 | Sweden 🇸🇪 | 7 | 47,362 | 1.9% |
| #11 | U.K. 🇬🇧 | 15 | 45,668 | 1.8% |
| #12 | Japan 🇯🇵 | 33 | 43,099 | 1.7% |
| #13 | India 🇮🇳 | 22 | 40,374 | 1.6% |
| #14 | Belgium 🇧🇪 | 7 | 32,793 | 1.3% |
| #15 | Czechia 🇨🇿 | 6 | 28,372 | 1.1% |
| Rest of the World 🌎 | 44 | 207,340 | 8.1% | |
| Total | 448 | 2,553,208 | 100.0% |
In the U.S., nuclear power produces over 50% of the country’s clean electricity. Additionally, 88 of the country’s 96 operating reactors in 2020 received approvals for a 20-year life extension.
China, the world’s second-largest nuclear power producer, is investing further in nuclear energy in a bid to achieve its climate goals. The plan, which includes building 150 new reactors by 2035, could cost as much as $440 billion.
On the other hand, European opinions on nuclear energy are mixed. Germany is the eighth-largest on the list but plans to shutter its last operating reactor in 2022 as part of its nuclear phase-out. France, meanwhile, plans to expand its nuclear capacity.
Which Countries Rely Most on Nuclear Energy?
Although total electricity generation is useful for a high-level global comparison, it’s important to remember that there are some smaller countries not featured above where nuclear is still an important part of the electricity mix.
Here’s a breakdown based on the share of nuclear energy in a country’s electricity mix:
| Rank | Country | Nuclear Share of Electricity Mix |
|---|---|---|
| #1 | France 🇫🇷 | 70.6% |
| #2 | Slovakia 🇸🇰 | 53.1% |
| #3 | Ukraine 🇺🇦 | 51.2% |
| #4 | Hungary 🇭🇺 | 48.0% |
| #5 | Bulgaria 🇧🇬 | 40.8% |
| #6 | Belgium 🇧🇪 | 39.1% |
| #7 | Slovenia 🇸🇮 | 37.8% |
| #8 | Czechia 🇨🇿 | 37.3% |
| #9 | Armenia 🇦🇲 | 34.5% |
| #10 | Finland 🇫🇮 | 33.9% |
| #11 | Switzerland 🇨🇭 | 32.9% |
| #12 | Sweden 🇸🇪 | 29.8% |
| #13 | South Korea 🇰🇷 | 29.6% |
| #14 | Spain 🇪🇸 | 22.2% |
| #15 | Russia 🇷🇺 | 20.6% |
| #16 | Romania 🇷🇴 | 19.9% |
| #17 | United States 🇺🇸 | 19.7% |
| #18 | Canada 🇨🇦 | 14.6% |
| #19 | United Kingdom 🇬🇧 | 14.5% |
| #20 | Germany 🇩🇪 | 11.3% |
European countries dominate the leaderboard with 14 of the top 15 spots, including France, where nuclear power is the country’s largest source of electricity.
It’s interesting to note that only a few of these countries are top producers of nuclear in absolute terms. For example, in Slovakia, nuclear makes up 53.6% of the electricity mix—however, the country’s four reactors make up less than 1% of total global operating capacity.
On the flipside, the U.S. ranks 17th by share of nuclear power in its mix, despite producing 31% of global nuclear electricity in 2020. This discrepancy is largely due to size and population. European countries are much smaller and produce less electricity overall than larger countries like the U.S. and China.
The Future of Nuclear Power
The nuclear power landscape is constantly changing.
There were over 50 additional nuclear reactors under construction in 2020, and hundreds more are planned primarily in Asia.
As countries turn away from fossil fuels and embrace carbon-free energy sources, nuclear energy might see a resurgence in the global energy mix despite the phase-outs planned in several countries around he globe.


Energy Shift
Visualizing Copper Production by Country in 2023
Chile and Peru account for one-third of the world’s copper output.


Visualizing Copper Production by Country in 2023
This was originally posted on our Voronoi app. Download the app for free on iOS or Android and discover incredible data-driven charts from a variety of trusted sources.
Copper is considered an essential metal for the clean energy transition because it is a great conductor of electricity.
As a result, governments around the world have been encouraging the construction of new mines, and mining companies have been seeking new projects and acquiring existing mines to meet the growing demand.
In this graphic, we illustrate global copper production in 2023, based on data from the U.S. Geological Survey, Mineral Commodity Summaries, as of January 2024.
Most Copper Comes from South America
Chile and Peru account for one-third of the world’s copper output.
| Country | Region | 2023E Production (Million tonnes) |
|---|---|---|
| 🇨🇱 Chile | South America | 5.0 |
| 🇵🇪 Peru | South America | 2.6 |
| 🇨🇩 Congo (Kinshasa) | Africa | 2.5 |
| 🇨🇳 China | Asia | 1.7 |
| 🇺🇸 United States | North America | 1.1 |
| 🇷🇺 Russia | Europe/Asia | 0.9 |
| 🇦🇺 Australia | Oceania | 0.8 |
| 🇮🇩 Indonesia | Asia | 0.8 |
| 🇿🇲 Zambia | Africa | 0.8 |
| 🇲🇽 Mexico | North America | 0.7 |
| 🇰🇿 Kazakhstan | Asia | 0.6 |
| 🇨🇦 Canada | North America | 0.5 |
| 🇵🇱 Poland | Europe | 0.4 |
| 🌍 Rest of World | -- | 3.1 |
| World total (rounded) | -- | 21.5 |
Chile is also home to the two largest mines in the world, Escondida and Collahuasi.
Meanwhile, African countries have rapidly increased their production. The Democratic Republic of Congo, for example, transitioned from being a secondary copper producer in the late 1990s to becoming the third-largest producer by 2023.
Part of the growth in copper mining in Africa is attributed to high investment from China. Chinese mining companies represent 8% of Africa’s total output in the mining sector.
Within its territory, China has also seen a 277% growth in copper production over the last three decades.
In the U.S., Arizona is the leading copper-producing state, accounting for approximately 70% of domestic output. Copper is also mined in Michigan, Missouri, Montana, Nevada, New Mexico, and Utah.
Energy Shift
Who’s Building the Most Solar Energy?
China’s solar capacity triples USA, nearly doubles EU.

Who’s Building the Most Solar Energy?
This was originally posted on our Voronoi app. Download the app for free on iOS or Android and discover incredible data-driven charts from a variety of trusted sources.
In 2023, solar energy accounted for three-quarters of renewable capacity additions worldwide. Most of this growth occurred in Asia, the EU, and the U.S., continuing a trend observed over the past decade.
In this graphic, we illustrate the rise in installed solar photovoltaic (PV) capacity in China, the EU, and the U.S. between 2010 and 2022, measured in gigawatts (GW). Bruegel compiled the data..
Chinese Dominance
As of 2022, China’s total installed capacity stands at 393 GW, nearly double that of the EU’s 205 GW and surpassing the USA’s total of 113 GW by more than threefold in absolute terms.
| Installed solar capacity (GW) | China | EU27 | U.S. |
|---|---|---|---|
| 2022 | 393.0 | 205.5 | 113.0 |
| 2021 | 307.0 | 162.7 | 95.4 |
| 2020 | 254.0 | 136.9 | 76.4 |
| 2019 | 205.0 | 120.1 | 61.6 |
| 2018 | 175.3 | 104.0 | 52.0 |
| 2017 | 130.8 | 96.2 | 43.8 |
| 2016 | 77.8 | 91.5 | 35.4 |
| 2015 | 43.6 | 87.7 | 24.2 |
| 2014 | 28.4 | 83.6 | 18.1 |
| 2013 | 17.8 | 79.7 | 13.3 |
| 2012 | 6.7 | 71.1 | 8.6 |
| 2011 | 3.1 | 53.3 | 5.6 |
| 2010 | 1.0 | 30.6 | 3.4 |
Since 2017, China has shown a compound annual growth rate (CAGR) of approximately 25% in installed PV capacity, while the USA has seen a CAGR of 21%, and the EU of 16%.
Additionally, China dominates the production of solar power components, currently controlling around 80% of the world’s solar panel supply chain.
In 2022, China’s solar industry employed 2.76 million individuals, with manufacturing roles representing approximately 1.8 million and the remaining 918,000 jobs in construction, installation, and operations and maintenance.
The EU industry employed 648,000 individuals, while the U.S. reached 264,000 jobs.
According to the IEA, China accounts for almost 60% of new renewable capacity expected to become operational globally by 2028.
Despite the phasing out of national subsidies in 2020 and 2021, deployment of solar PV in China is accelerating. The country is expected to reach its national 2030 target for wind and solar PV installations in 2024, six years ahead of schedule.

-

 Electrification3 years ago
Ranked: The Top 10 EV Battery Manufacturers
-

 Electrification2 years ago
The Key Minerals in an EV Battery
-

 Real Assets3 years ago
The World’s Top 10 Gold Mining Companies
-

 Electrification3 years ago
Mapped: Solar Power by Country in 2021
-

 Misc3 years ago
All the Metals We Mined in One Visualization
-

 Energy Shift2 years ago
What Are the Five Major Types of Renewable Energy?
-

 Electrification2 years ago
The World’s Largest Nickel Mining Companies
-

 Misc3 years ago
The Largest Copper Mines in the World by Capacity