

Real Assets
The Next Frontier: Mineral Exploration in Saskatchewan
The Next Frontier: Mineral Exploration in Saskatchewan
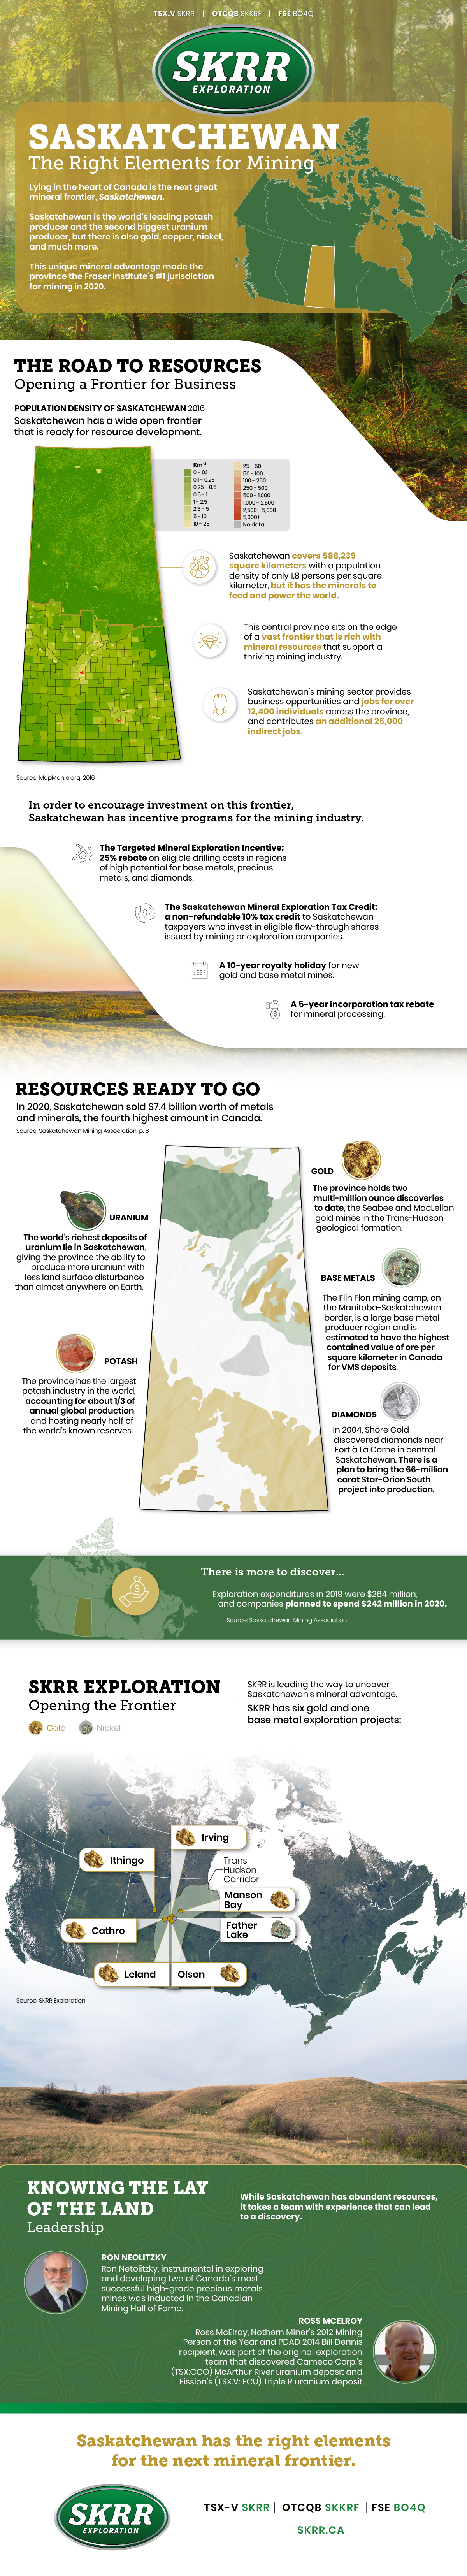
Lying in the heart of Canada is the next great mineral exploration frontier, Saskatchewan. This humble province lies at the center of one of the greatest mining countries in the world, but despite Canada’s long history with mining, Saskatchewan is still open for discovery.
This infographic from our sponsor SKRR Exploration shows where the next mineral frontier for discovery lies in Saskatchewan.
The Road to Resources: Opening for Business
Saskatchewan covers 588,239 square kilometers, roughly the size of Iran or Mongolia, with a population density of only 1.8 persons per square kilometer. This central province sits on the edge of a vast frontier that is rich with mineral resources that could power and feed the world.
In order to encourage investment, Saskatchewan has several incentive programs for the mining industry.
- The Targeted Mineral Exploration Incentive: 25% rebate on eligible drilling costs in regions of high potential for base metals, precious metals and diamonds.
- The Saskatchewan Mineral Exploration Tax Credit: A non-refundable 10% tax credit to Saskatchewan taxpayers who invest in eligible flow-through shares issued by mining or exploration companies.
- A 10-year royalty holiday for new gold and base metal mines.
- A 5-year incorporation tax rebate for mineral processing.
While the province is encouraging mineral exploration, there are already proven success stories that are just scraping the surface of the opportunities available.
Resources Ready to Go
In 2020, Saskatchewan sold C$7.4 billion worth of metals and minerals, the fourth highest amount in Canada. Saskatchewan’s mining sector provides business opportunities and jobs for over 12,400 individuals across the province, and contributes an additional 25,000 indirect jobs.
- Potash: The province has the largest potash industry in the world, accounting for about 1/3 of annual global production and hosting nearly half of the world’s known reserves.
- Uranium: The world’s richest deposits of uranium lie in Saskatchewan, giving the province the ability to produce more uranium with less land surface disturbance than almost anywhere on Earth.
- Diamonds: In 2004, Shore Gold discovered diamonds near Fort à La Corne in central Saskatchewan. There is a plan to bring the 66-million carat Star-Orion South project into production.
- Base Metals: The Flin Flon mining camp, on the Manitoba-Saskatchewan border, is a large base metal producer region and is estimated to have the highest contained value of ore per square kilometer in Canada for VMS deposits.
- Gold: The province holds two multi-million ounce discoveries to date, the Seabee and MacLellan gold mines in the Trans-Hudson geological formation.
There is more to discovery. Exploration expenditures in 2019 were $264 million, and companies planned to spend $242 million in 2020.
SKRR Exploration: Opening a Frontier
SKRR Exploration is leading mineral exploration into Canada’s final frontier and has secured prime mineral properties to take advantage of the wave of demand for metals. SKRR has six gold and one base metal exploration projects in the heart of one of the most prospective geological belts in North America.
At the helm of SKRR exploration are two leaders who know the geology of Saskatchewan well and have a proven history of discovery, Ron Neolitzky and Ross McElroy. Neolitzky was inducted into the Canadian Mining Hall of Fame for his development of two successful precious metals mines. McElroy was part of the exploration team that discovered Cameco’s McArthur uranium deposit.
SKRR Exploration is bringing together the right elements of Saskatchewan to make the next great discovery.


Real Assets
Charted: The Value Gap Between the Gold Price and Gold Miners
While gold prices hit all-time highs, gold mining stocks have lagged far behind.

Gold Price vs. Gold Mining Stocks
This was originally posted on our Voronoi app. Download the app for free on Apple or Android and discover incredible data-driven charts from a variety of trusted sources.
Although the price of gold has reached new record highs in 2024, gold miners are still far from their 2011 peaks.
In this graphic, we illustrate the evolution of gold prices since 2000 compared to the NYSE Arca Gold BUGS Index (HUI), which consists of the largest and most widely held public gold production companies. The data was compiled by Incrementum AG.
Mining Stocks Lag Far Behind
In April 2024, gold reached a new record high as Federal Reserve Chair Jerome Powell signaled policymakers may delay interest rate cuts until clearer signs of declining inflation materialize.
Additionally, with elections occurring in more than 60 countries in 2024 and ongoing conflicts in Ukraine and Gaza, central banks are continuing to buy gold to strengthen their reserves, creating momentum for the metal.
Traditionally known as a hedge against inflation and a safe haven during times of political and economic uncertainty, gold has climbed over 11% so far this year.
According to Business Insider, gold miners experienced their best performance in a year in March 2024. During that month, the gold mining sector outperformed all other U.S. industries, surpassing even the performance of semiconductor stocks.
Still, physical gold has outperformed shares of gold-mining companies over the past three years by one of the largest margins in decades.
| Year | Gold Price | NYSE Arca Gold BUGS Index (HUI) |
|---|---|---|
| 2023 | $2,062.92 | $243.31 |
| 2022 | $1,824.32 | $229.75 |
| 2021 | $1,828.60 | $258.87 |
| 2020 | $1,895.10 | $299.64 |
| 2019 | $1,523.00 | $241.94 |
| 2018 | $1,281.65 | $160.58 |
| 2017 | $1,296.50 | $192.31 |
| 2016 | $1,151.70 | $182.31 |
| 2015 | $1,060.20 | $111.18 |
| 2014 | $1,199.25 | $164.03 |
| 2013 | $1,201.50 | $197.70 |
| 2012 | $1,664.00 | $444.22 |
| 2011 | $1,574.50 | $498.73 |
| 2010 | $1,410.25 | $573.32 |
| 2009 | $1,104.00 | $429.91 |
| 2008 | $865.00 | $302.41 |
| 2007 | $836.50 | $409.37 |
| 2006 | $635.70 | $338.24 |
| 2005 | $513.00 | $276.90 |
| 2004 | $438.00 | $215.33 |
| 2003 | $417.25 | $242.93 |
| 2002 | $342.75 | $145.12 |
| 2001 | $276.50 | $65.20 |
| 2000 | $272.65 | $40.97 |
Among the largest companies on the NYSE Arca Gold BUGS Index, Colorado-based Newmont has experienced a 24% drop in its share price over the past year. Similarly, Canadian Barrick Gold also saw a decline of 6.5% over the past 12 months.
Real Assets
200 Years of Global Gold Production, by Country
Global gold production has grown exponentially since the 1800s, with 86% of all above-ground gold mined in the last 200 years.


Visualizing Global Gold Production Over 200 Years
Although the practice of gold mining has been around for thousands of years, it’s estimated that roughly 86% of all above-ground gold was extracted in the last 200 years.
With modern mining techniques making large-scale production possible, global gold production has grown exponentially since the 1800s.
The above infographic uses data from Our World in Data to visualize global gold production by country from 1820 to 2022, showing how gold mining has evolved to become increasingly global over time.
A Brief History of Gold Mining
The best-known gold rush in modern history occurred in California in 1848, when James Marshall discovered gold in Sacramento Valley. As word spread, thousands of migrants flocked to California in search of gold, and by 1855, miners had extracted around $2 billion worth of gold.
The United States, Australia, and Russia were (interchangeably) the three largest gold producers until the 1890s. Then, South Africa took the helm thanks to the massive discovery in the Witwatersrand Basin, now regarded today as one of the world’s greatest ever goldfields.
South Africa’s annual gold production peaked in 1970 at 1,002 tonnes—by far the largest amount of gold produced by any country in a year.
With the price of gold rising since the 1980s, global gold production has become increasingly widespread. By 2007, China was the world’s largest gold-producing nation, and today a significant quantity of gold is being mined in over 40 countries.
The Top Gold-Producing Countries in 2022
Around 31% of the world’s gold production in 2022 came from three countries—China, Russia, and Australia, with each producing over 300 tonnes of the precious metal.
| Rank | Country | 2022E Gold Production, tonnes | % of Total |
|---|---|---|---|
| #1 | 🇨🇳 China | 330 | 11% |
| #2 | 🇷🇺 Russia | 320 | 10% |
| #3 | 🇦🇺 Australia | 320 | 10% |
| #4 | 🇨🇦 Canada | 220 | 7% |
| #5 | 🇺🇸 United States | 170 | 5% |
| #6 | 🇲🇽 Mexico | 120 | 4% |
| #7 | 🇰🇿 Kazakhstan | 120 | 4% |
| #8 | 🇿🇦 South Africa | 110 | 4% |
| #9 | 🇵🇪 Peru | 100 | 3% |
| #10 | 🇺🇿 Uzbekistan | 100 | 3% |
| #11 | 🇬🇭 Ghana | 90 | 3% |
| #12 | 🇮🇩 Indonesia | 70 | 2% |
| - | 🌍 Rest of the World | 1,030 | 33% |
| - | World Total | 3,100 | 100% |
North American countries Canada, the U.S., and Mexico round out the top six gold producers, collectively making up 16% of the global total. The state of Nevada alone accounted for 72% of U.S. production, hosting the world’s largest gold mining complex (including six mines) owned by Nevada Gold Mines.
Meanwhile, South Africa produced 110 tonnes of gold in 2022, down by 74% relative to its output of 430 tonnes in 2000. This long-term decline is the result of mine closures, maturing assets, and industrial conflict, according to the World Gold Council.
Interestingly, two smaller gold producers on the list, Uzbekistan and Indonesia, host the second and third-largest gold mining operations in the world, respectively.
The Outlook for Global Gold Production
As of April 25, gold prices were hovering around the $2,000 per ounce mark and nearing all-time highs. For mining companies, higher gold prices can mean more profits per ounce if costs remain unaffected.
According to the World Gold Council, mined gold production is expected to increase in 2023 and could surpass the record set in 2018 (3,300 tonnes), led by the expansion of existing projects in North America. The chances of record mine output could be higher if gold prices continue to increase.

-

 Electrification3 years ago
Ranked: The Top 10 EV Battery Manufacturers
-

 Electrification2 years ago
The Key Minerals in an EV Battery
-

 Real Assets3 years ago
The World’s Top 10 Gold Mining Companies
-

 Misc3 years ago
All the Metals We Mined in One Visualization
-

 Electrification3 years ago
The Biggest Mining Companies in the World in 2021
-

 Energy Shift2 years ago
What Are the Five Major Types of Renewable Energy?
-

 Electrification2 years ago
Mapped: Solar Power by Country in 2021
-

 Electrification2 years ago
The World’s Largest Nickel Mining Companies