

Real Assets
Visualizing Gold Investment Compared to Global Assets
How Gold Compares to Global Assets
Gold has been a vital asset for investors and speculators to hedge against uncertainty and currency devaluation, but today it is just a small part of the investment landscape.
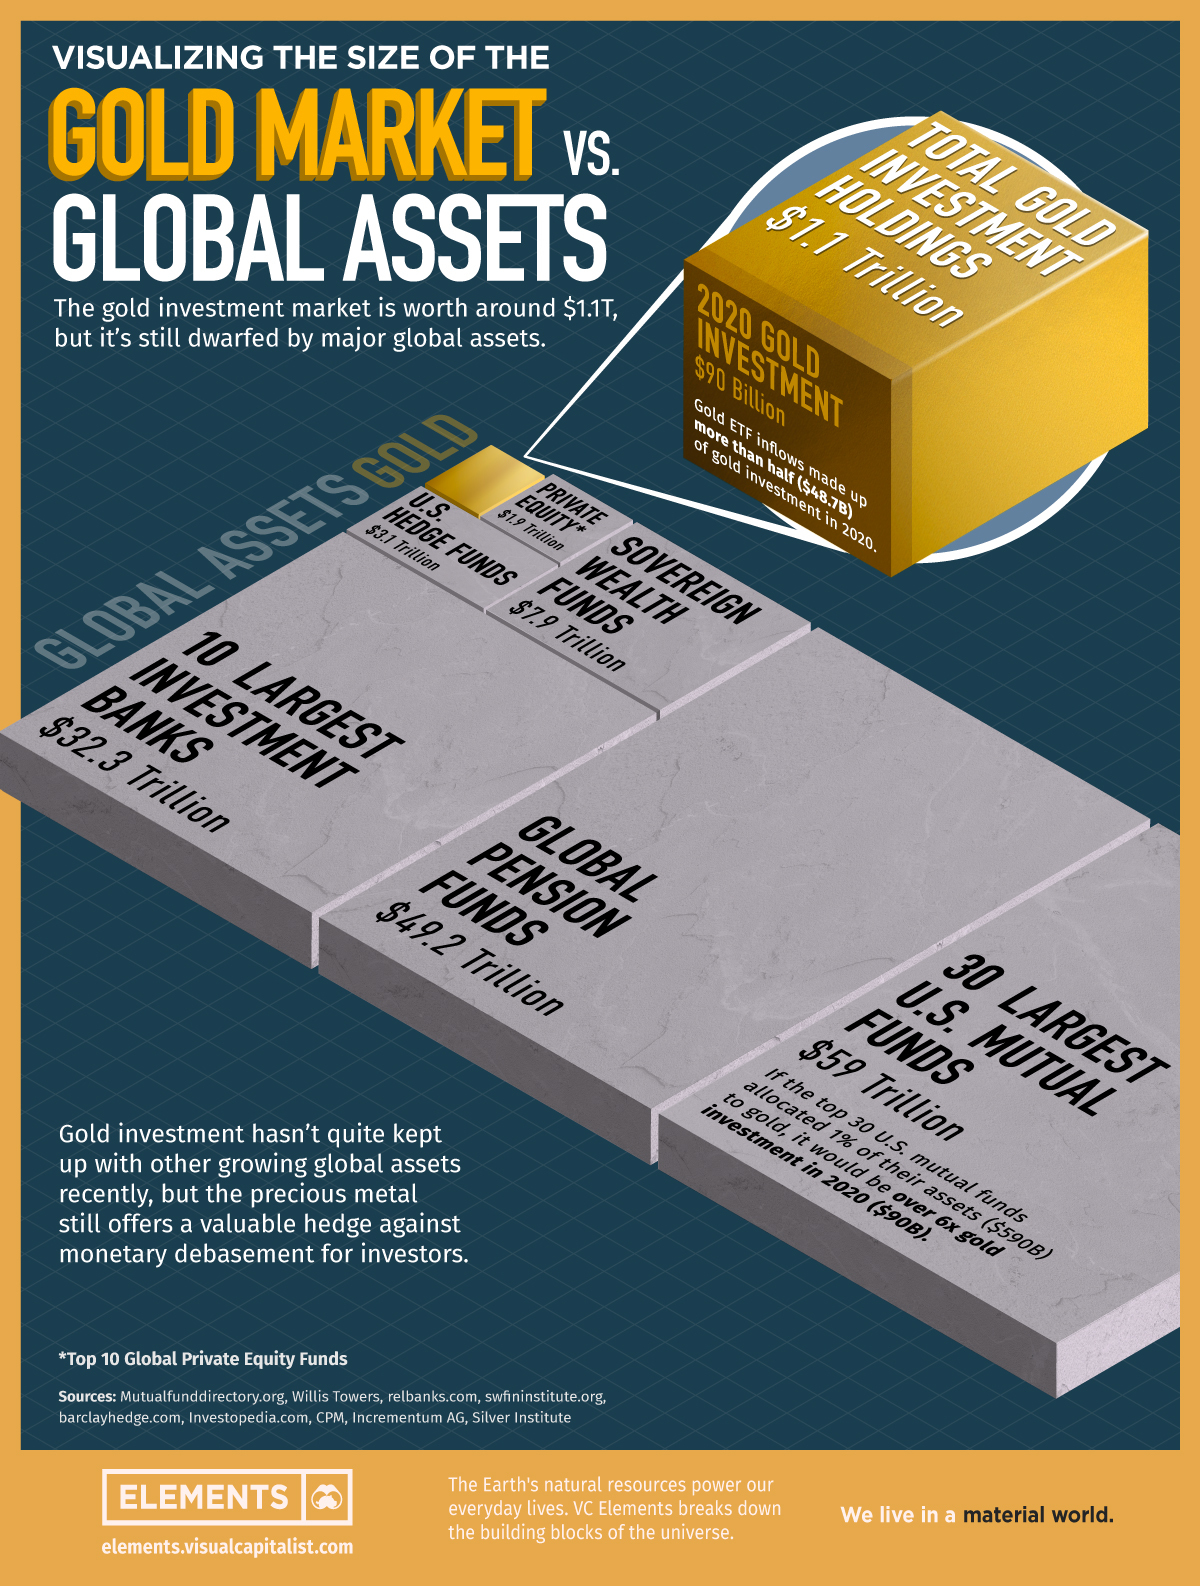
While gold investment holdings stand at $1.1T, this figure is dwarfed by various other global assets and funds.
This graphic compares the size of gold investment holdings to global assets, highlighting the difference in dollars invested, and where modern day investors have (or haven’t) been allocating their money.
Gold vs. Global Assets
Despite amounting to over $1 trillion dollars, gold investment holdings are a small fish in the large pond of major global assets.
Largely outsized by private equity funds, hedge funds, and more, gold has taken a backseat for today’s investors when it comes to where they allocate their capital.
| Asset | Value |
|---|---|
| 2020 Gold Investment | $90.0B |
| Total Gold Investment Holdings | $1.1T |
| Top 10 Global Private Equity Funds | $1.9T |
| U.S. Hedge Funds | $3.1T |
| Sovereign Wealth Funds | $7.9T |
| 10 Largest Investment Banks | $32.3T |
| Global Pension Funds | $49.3T |
| 30 Largest U.S. Mutual Funds | $59.0T |
Sources: Mutualfunddirectory.org, Willis Towers, relbanks.com, swfininstitute.org, barclayhedge.com, investopedia.com, CPM, Incrementum AG
Even with 2020’s large inflow of gold investment worth $90 billion, gold investment remains small on the scale of the world’s financial assets.
With its fairly small market, around 90% of gold’s global trading volume flows through three major exchanges, with the remaining volume coming from smaller OTC and secondary markets.
The Major Gold Exchanges Today
Although gold investment has been overtaken by other global assets, it still remains an important investment asset and has one of the most active markets in the world. Gold markets are split among three primary trading hubs which transact millions of dollars in volume every day.
- London Metal Exchange (LME): Established in 1877, the LME offers futures contracts for metals including gold.
- COMEX: A division of the Chicago Mercantile Exchange (CME) COMEX offers physically settled gold futures and options contracts.
- Shanghai Futures Exchange (SHFE) and Shanghai Gold Exchange (SGE): While relatively young, these two exchanges have captured a large amount of gold trading volume, with the SGE being the largest purely physical gold spot exchange in the world.
Gold Exchange Trading Volumes
| Gold Exchange | FY 2020 Trading Volume |
|---|---|
| London Metal Exchange (LME) | $160M |
| COMEX | $54.4B |
| Shanghai Futures Exchange (SHFE) | $6.19B |
| Shanghai Gold Exchange (SGE) | $6.22B |
Source: World Gold Council
These three hubs and four exchanges host the majority of the world’s gold trading, and saw ~$67B worth of gold trading volume in the fiscal year of 2020.
ETFs are Making Gold Investment Accessible
While the exchanges mentioned above transact millions of dollars worth of gold a day, gold-backed ETFs have made gold more accessible to the everyday investor. The top 3 U.S.-traded gold ETFs have more than $94B in assets under management between each other.
These ETFs offer investors one of the easiest ways to get gold exposure in their investment accounts, and see billions in flows every year.
Quarterly Gold ETF Flows
| Region | Q1 2020 | Q2 2020 | Q3 2020 | Q4 2020 | Q1 2021 | Q2 2021 |
|---|---|---|---|---|---|---|
| North America | $6.8B | $18.2B | $11.8B | -$5B | -$8.1B | $1.1B |
| Europe | $8.1B | $4.4B | $3.4B | -$2.1B | -$2.4B | $1.6B |
| Asia | $0.7B | $0.5B | $1.2B | -$0.3B | $1B | -$0.1B |
| Other | $0.3B | $0.5B | $0.4B | -$0.3B | $0.1B | -$0.1B |
| Total | $15.9B | $23.6B | $16.8B | -$7.7B | -$9.4B | $2.5B |
Source: World Gold Council
Last year saw record inflows into gold ETFs, as investors sought a safe haven for their capital during the COVID-19 pandemic. However, gold ETFs have seen an overall outflow of $6.1B in 2021 so far, with North American gold ETFs seeing $402M in outflows just this July.
At the same time, European gold ETFs have seen a recent rise in inflows, highlighting a divergence in sentiment between the two regions. In the month of July, European gold ETFs saw $999M worth of inflows, with Asian gold ETFs also registering positive inflows of $54M.
Central Banks Still Believe in Gold’s Future
While gold is not attracting immediate investment flow into ETFs, the world’s central banks still maintain large amounts of their reserve assets in gold. While they primarily hold gold to hedge against currency depreciation and to diversify their reserves, gold has proved an incredibly valuable investment for central banks over the decades.
Some central banks like the U.S., Germany, and Italy, have more than 50% of their reserves’ dollar value in gold, showing truly how much they value the precious metal.
With the world’s central banks holding around $1.69T worth of gold in their reserves currently, gold remains an essential investment for both big and small players alike.


Real Assets
Charted: The Value Gap Between the Gold Price and Gold Miners
While gold prices hit all-time highs, gold mining stocks have lagged far behind.

Gold Price vs. Gold Mining Stocks
This was originally posted on our Voronoi app. Download the app for free on Apple or Android and discover incredible data-driven charts from a variety of trusted sources.
Although the price of gold has reached new record highs in 2024, gold miners are still far from their 2011 peaks.
In this graphic, we illustrate the evolution of gold prices since 2000 compared to the NYSE Arca Gold BUGS Index (HUI), which consists of the largest and most widely held public gold production companies. The data was compiled by Incrementum AG.
Mining Stocks Lag Far Behind
In April 2024, gold reached a new record high as Federal Reserve Chair Jerome Powell signaled policymakers may delay interest rate cuts until clearer signs of declining inflation materialize.
Additionally, with elections occurring in more than 60 countries in 2024 and ongoing conflicts in Ukraine and Gaza, central banks are continuing to buy gold to strengthen their reserves, creating momentum for the metal.
Traditionally known as a hedge against inflation and a safe haven during times of political and economic uncertainty, gold has climbed over 11% so far this year.
According to Business Insider, gold miners experienced their best performance in a year in March 2024. During that month, the gold mining sector outperformed all other U.S. industries, surpassing even the performance of semiconductor stocks.
Still, physical gold has outperformed shares of gold-mining companies over the past three years by one of the largest margins in decades.
| Year | Gold Price | NYSE Arca Gold BUGS Index (HUI) |
|---|---|---|
| 2023 | $2,062.92 | $243.31 |
| 2022 | $1,824.32 | $229.75 |
| 2021 | $1,828.60 | $258.87 |
| 2020 | $1,895.10 | $299.64 |
| 2019 | $1,523.00 | $241.94 |
| 2018 | $1,281.65 | $160.58 |
| 2017 | $1,296.50 | $192.31 |
| 2016 | $1,151.70 | $182.31 |
| 2015 | $1,060.20 | $111.18 |
| 2014 | $1,199.25 | $164.03 |
| 2013 | $1,201.50 | $197.70 |
| 2012 | $1,664.00 | $444.22 |
| 2011 | $1,574.50 | $498.73 |
| 2010 | $1,410.25 | $573.32 |
| 2009 | $1,104.00 | $429.91 |
| 2008 | $865.00 | $302.41 |
| 2007 | $836.50 | $409.37 |
| 2006 | $635.70 | $338.24 |
| 2005 | $513.00 | $276.90 |
| 2004 | $438.00 | $215.33 |
| 2003 | $417.25 | $242.93 |
| 2002 | $342.75 | $145.12 |
| 2001 | $276.50 | $65.20 |
| 2000 | $272.65 | $40.97 |
Among the largest companies on the NYSE Arca Gold BUGS Index, Colorado-based Newmont has experienced a 24% drop in its share price over the past year. Similarly, Canadian Barrick Gold also saw a decline of 6.5% over the past 12 months.
Real Assets
200 Years of Global Gold Production, by Country
Global gold production has grown exponentially since the 1800s, with 86% of all above-ground gold mined in the last 200 years.


Visualizing Global Gold Production Over 200 Years
Although the practice of gold mining has been around for thousands of years, it’s estimated that roughly 86% of all above-ground gold was extracted in the last 200 years.
With modern mining techniques making large-scale production possible, global gold production has grown exponentially since the 1800s.
The above infographic uses data from Our World in Data to visualize global gold production by country from 1820 to 2022, showing how gold mining has evolved to become increasingly global over time.
A Brief History of Gold Mining
The best-known gold rush in modern history occurred in California in 1848, when James Marshall discovered gold in Sacramento Valley. As word spread, thousands of migrants flocked to California in search of gold, and by 1855, miners had extracted around $2 billion worth of gold.
The United States, Australia, and Russia were (interchangeably) the three largest gold producers until the 1890s. Then, South Africa took the helm thanks to the massive discovery in the Witwatersrand Basin, now regarded today as one of the world’s greatest ever goldfields.
South Africa’s annual gold production peaked in 1970 at 1,002 tonnes—by far the largest amount of gold produced by any country in a year.
With the price of gold rising since the 1980s, global gold production has become increasingly widespread. By 2007, China was the world’s largest gold-producing nation, and today a significant quantity of gold is being mined in over 40 countries.
The Top Gold-Producing Countries in 2022
Around 31% of the world’s gold production in 2022 came from three countries—China, Russia, and Australia, with each producing over 300 tonnes of the precious metal.
| Rank | Country | 2022E Gold Production, tonnes | % of Total |
|---|---|---|---|
| #1 | 🇨🇳 China | 330 | 11% |
| #2 | 🇷🇺 Russia | 320 | 10% |
| #3 | 🇦🇺 Australia | 320 | 10% |
| #4 | 🇨🇦 Canada | 220 | 7% |
| #5 | 🇺🇸 United States | 170 | 5% |
| #6 | 🇲🇽 Mexico | 120 | 4% |
| #7 | 🇰🇿 Kazakhstan | 120 | 4% |
| #8 | 🇿🇦 South Africa | 110 | 4% |
| #9 | 🇵🇪 Peru | 100 | 3% |
| #10 | 🇺🇿 Uzbekistan | 100 | 3% |
| #11 | 🇬🇭 Ghana | 90 | 3% |
| #12 | 🇮🇩 Indonesia | 70 | 2% |
| - | 🌍 Rest of the World | 1,030 | 33% |
| - | World Total | 3,100 | 100% |
North American countries Canada, the U.S., and Mexico round out the top six gold producers, collectively making up 16% of the global total. The state of Nevada alone accounted for 72% of U.S. production, hosting the world’s largest gold mining complex (including six mines) owned by Nevada Gold Mines.
Meanwhile, South Africa produced 110 tonnes of gold in 2022, down by 74% relative to its output of 430 tonnes in 2000. This long-term decline is the result of mine closures, maturing assets, and industrial conflict, according to the World Gold Council.
Interestingly, two smaller gold producers on the list, Uzbekistan and Indonesia, host the second and third-largest gold mining operations in the world, respectively.
The Outlook for Global Gold Production
As of April 25, gold prices were hovering around the $2,000 per ounce mark and nearing all-time highs. For mining companies, higher gold prices can mean more profits per ounce if costs remain unaffected.
According to the World Gold Council, mined gold production is expected to increase in 2023 and could surpass the record set in 2018 (3,300 tonnes), led by the expansion of existing projects in North America. The chances of record mine output could be higher if gold prices continue to increase.

-

 Electrification3 years ago
Ranked: The Top 10 EV Battery Manufacturers
-

 Electrification2 years ago
The Key Minerals in an EV Battery
-

 Real Assets3 years ago
The World’s Top 10 Gold Mining Companies
-

 Misc3 years ago
All the Metals We Mined in One Visualization
-

 Electrification3 years ago
The Biggest Mining Companies in the World in 2021
-

 Energy Shift2 years ago
What Are the Five Major Types of Renewable Energy?
-

 Electrification2 years ago
The World’s Largest Nickel Mining Companies
-

 Electrification2 years ago
Mapped: Solar Power by Country in 2021