

Energy Shift
Should You Invest in Disruptive Materials?
The following content is sponsored by the Global X ETFs
Should You Invest in Disruptive Materials?
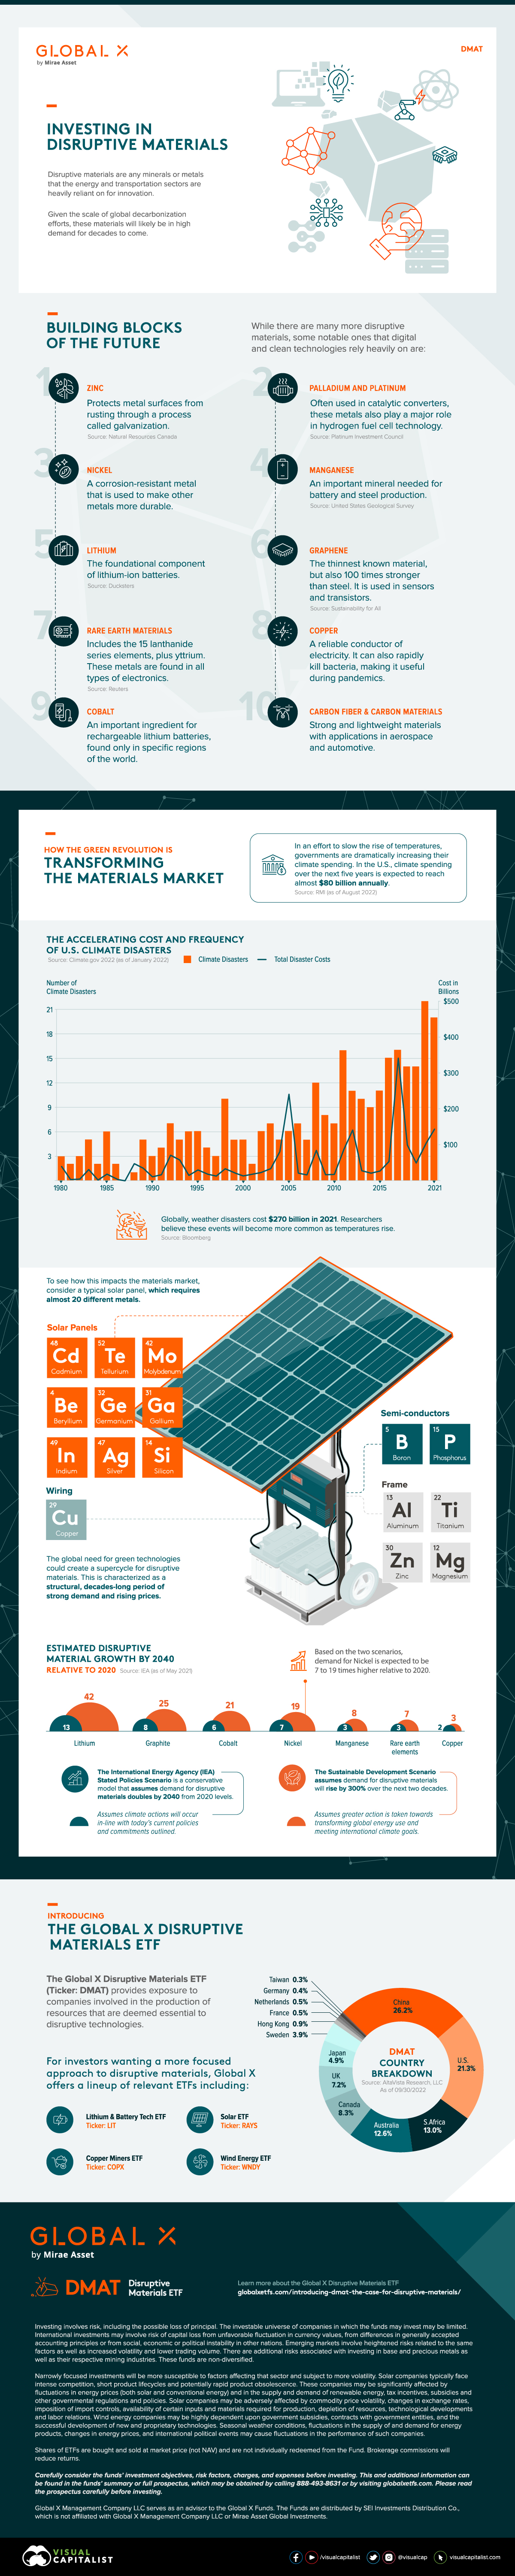
New technologies are having a transformative impact on the transportation and energy sectors. As these technologies develop, it is becoming clear that a small selection of materials, metals, and minerals—known collectively as disruptive materials—are critical components required to innovate.
This graphic from Global X ETFs takes a closer look at the disruptive materials that are key to fueling climate technologies. With a growing global effort to decarbonize, disruptive materials may enter a demand supercycle, characterized as a structural decades-long period of rising demand and rising prices.
Building Blocks Of the Future
There are 10 categories of disruptive materials in particular that are expected to see demand growth as part of their role within emerging technologies.
| Disruptive Material | Applicability |
|---|---|
| Zinc | Protects metal surfaces from rusting through a process called galvanization. This is essential to wind energy. |
| Palladium & Platinum | Often used in catalytic converters, thus playing a major role in hydrogen fuel cell technology. |
| Nickel | A corrosion-resistant metal used to make other metals more durable. |
| Manganese | An important mineral needed for battery and steel production. |
| Lithium | The foundational component of lithium-ion batteries. |
| Graphene | The thinnest known material which is also 100x stronger than steel. Used in sensors and transistors. |
| Rare Earth Materials | A broader category including 15 lanthanide series elements, plus yttrium. These metals are found in all types of electronics. |
| Copper | A reliable conductor of electricity. It can also kill bacteria, making it useful during pandemics. |
| Cobalt | An important ingredient for rechargeable lithium batteries, found only in specific regions of the world. |
| Carbon Fiber & Carbon Materials | Strong and lightweight materials with applications in aerospace and the automotive industry. |
While these 10 categories do not make up the entire disruptive material universe, all are essential to securing a climate and technologically advanced future.
How The Green Revolution Is Transforming the Materials Market
The data on rising global temperatures and extreme weather events is jarring and has governments and organizations from all over the world ramping up efforts to combat its effects through new budgets and policies.
Take the soaring total number of U.S. climate disasters for instance. Most recently in 2021, the quantity of weather disasters stood at 20 whereas in 1980 it stood as a much smaller figure of three. In addition, total disaster costs have risen above $100 billion per year.
Globally, the top 10 most extreme weather events in 2021 racked up $170 billion in costs.
| Rank | Climate Event | Cost ($B) |
|---|---|---|
| #1 | Hurricane Ida | $65.0B |
| #2 | European floods | $43.0B |
| #3 | Texas winter storm | $23.0B |
| #4 | Henan floods | $17.6B |
| #5 | British Columbia floods | $7.5B |
| #6 | France’s “cold wave” | $5.6B |
| #7 | Cyclone Yaas | $3.0B |
| #8 | Australian floods | $2.1B |
| #9 | Typhoon In-fa | $2.0B |
| #10 | Cyclone Tauktae | $1.5B |
What’s more, some research estimates that these rising costs are far from coming to a halt. By 2050 the annual cost of weather disasters could surge past $1 trillion a year. In an effort to slow rising temperatures, governments are dramatically increasing their climate spending. For example, the U.S. is set to spend $80 billion annually over the next five years.
To see how climate spending impacts the materials market, consider the complexity behind a typical solar panel which requires almost 20 different materials including copper for wiring, boron and phosphorus for semiconductors, as well as zinc and magnesium for its frame.
Overall, these materials are essential to the expansion of a variety of emerging technologies like lithium batteries, solar panels, wind turbines, fuel cells, robotics, and 3D printers. And therefore, are translating to higher levels of demand for the disruptive materials that make combating climate change possible.
Estimated Disruptive Material Growth by 2040
A societal shift in how we address climate change is forecasted to lead to a demand supercycle for disruptive materials and acts as a massive tailwind.
But just how large is this expected level of demand to be? To answer this, we use two scenarios created by The International Energy Agency (IEA). The first is the Stated Policies Scenario, a more conservative model that assumes demand for material will double by 2040 relative to 2020 levels. Under this scenario, it’s assumed that society takes climate action in line with current and existing policies and commitments.
Then there is the Sustainable Development Scenario, which assumes more drastic action will take place to transform global energy use and meet international climate goals. Under this scenario, the demand for disruptive materials could rise as high as 300% relative to 2020 levels.
However, under both scenarios there’s still significant demand for each type of material.
| Disruptive Material | Stated Policies Scenario Demand Relative to 2020 | Sustainable Development Scenario Demand Relative to 2020 |
|---|---|---|
| Lithium | 13X | 42X |
| Graphite | 8X | 25X |
| Cobalt | 6X | 21X |
| Nickel | 7X | 19X |
| Manganese | 3X | 8X |
| Rare earth elements | 3X | 7X |
| Copper | 2X | 3X |
Overall, lithium is expected to see the most explosive surge in demand, as it could reach anywhere from 13 to 42 times the level of demand seen in 2020, based on the above scenarios.
Introducing the Global X Disruptive Materials ETF
The Global X Disruptive Materials ETF (Ticker: DMAT) seeks to provide investment results that correspond generally to the price and yield performance, before fees and expenses, of the Solactive Disruptive Materials Index.
Investors can use this passively managed solution to gain exposure to the rising demand for disruptive materials and climate technologies.
The Global X Disruptive Materials ETF is a passively managed solution that can be used to gain exposure to the rising demand for disruptive materials. Click the link to learn more.


Energy Shift
The World’s Biggest Oil Producers in 2023
Just three countries accounted for 40% of global oil production last year.

The World’s Biggest Oil Producers in 2023
This was originally posted on our Voronoi app. Download the app for free on iOS or Android and discover incredible data-driven charts from a variety of trusted sources.
Despite efforts to decarbonize the global economy, oil still remains one of the world’s most important resources. It’s also produced by a fairly limited group of countries, which can be a source of economic and political leverage.
This graphic illustrates global crude oil production in 2023, measured in million barrels per day, sourced from the U.S. Energy Information Administration (EIA).
Three Countries Account for 40% of Global Oil Production
In 2023, the United States, Russia, and Saudi Arabia collectively contributed 32.7 million barrels per day to global oil production.
| Oil Production 2023 | Million barrels per day |
|---|---|
| 🇺🇸 U.S. | 12.9 |
| 🇷🇺 Russia | 10.1 |
| 🇸🇦 Saudi Arabia | 9.7 |
| 🇨🇦 Canada | 4.6 |
| 🇮🇶 Iraq | 4.3 |
| 🇨🇳 China | 4.2 |
| 🇮🇷 Iran | 3.6 |
| 🇧🇷 Brazil | 3.4 |
| 🇦🇪 UAE | 3.4 |
| 🇰🇼 Kuwait | 2.7 |
| 🌍 Other | 22.8 |
These three nations have consistently dominated oil production since 1971. The leading position, however, has alternated among them over the past five decades.
In contrast, the combined production of the next three largest producers—Canada, Iraq, and China—reached 13.1 million barrels per day in 2023, just surpassing the production of the United States alone.
In the near term, no country is likely to surpass the record production achieved by the U.S. in 2023, as no other producer has ever reached a daily capacity of 13.0 million barrels. Recently, Saudi Arabia’s state-owned Saudi Aramco scrapped plans to increase production capacity to 13.0 million barrels per day by 2027.
In 2024, analysts forecast that the U.S. will maintain its position as the top oil producer. In fact, according to Macquarie Group, U.S. oil production is expected to achieve a record pace of about 14 million barrels per day by the end of the year.
Energy Shift
How Much Does the U.S. Depend on Russian Uranium?
Despite a new uranium ban being discussed in Congress, the U.S. is still heavily dependent on Russian uranium.

How Much Does the U.S. Depend on Russian Uranium?
This was originally posted on our Voronoi app. Download the app for free on iOS or Android and discover incredible data-driven charts from a variety of trusted sources.
The U.S. House of Representatives recently passed a ban on imports of Russian uranium. The bill must pass the Senate before becoming law.
In this graphic, we visualize how much the U.S. relies on Russian uranium, based on data from the United States Energy Information Administration (EIA).
U.S. Suppliers of Enriched Uranium
After Russia invaded Ukraine, the U.S. imposed sanctions on Russian-produced oil and gas—yet Russian-enriched uranium is still being imported.
Currently, Russia is the largest foreign supplier of nuclear power fuel to the United States. In 2022, Russia supplied almost a quarter of the enriched uranium used to fuel America’s fleet of more than 90 commercial reactors.
| Country of enrichment service | SWU* | % |
|---|---|---|
| 🇺🇸 United States | 3,876 | 27.34% |
| 🇷🇺 Russia | 3,409 | 24.04% |
| 🇩🇪 Germany | 1,763 | 12.40% |
| 🇬🇧 United Kingdom | 1,593 | 11.23% |
| 🇳🇱 Netherlands | 1,303 | 9.20% |
| Other | 2,232 | 15.79% |
| Total | 14,176 | 100% |
SWU stands for “Separative Work Unit” in the uranium industry. It is a measure of the amount of work required to separate isotopes of uranium during the enrichment process. Source: U.S. Energy Information Administration
Most of the remaining uranium is imported from European countries, while another portion is produced by a British-Dutch-German consortium operating in the United States called Urenco.
Similarly, nearly a dozen countries around the world depend on Russia for more than half of their enriched uranium—and many of them are NATO-allied members and allies of Ukraine.
In 2023 alone, the U.S. nuclear industry paid over $800 million to Russia’s state-owned nuclear energy corporation, Rosatom, and its fuel subsidiaries.
It is important to note that 19% of electricity in the U.S. is powered by nuclear plants.
The dependency on Russian fuels dates back to the 1990s when the United States turned away from its own enrichment capabilities in favor of using down-blended stocks of Soviet-era weapons-grade uranium.
As part of the new uranium-ban bill, the Biden administration plans to allocate $2.2 billion for the expansion of uranium enrichment facilities in the United States.

-

 Electrification3 years ago
Ranked: The Top 10 EV Battery Manufacturers
-

 Electrification2 years ago
The Key Minerals in an EV Battery
-

 Real Assets3 years ago
The World’s Top 10 Gold Mining Companies
-

 Misc3 years ago
All the Metals We Mined in One Visualization
-

 Electrification3 years ago
The Biggest Mining Companies in the World in 2021
-

 Energy Shift2 years ago
What Are the Five Major Types of Renewable Energy?
-

 Electrification2 years ago
Mapped: Solar Power by Country in 2021
-

 Electrification2 years ago
The World’s Largest Nickel Mining Companies