

Electrification
How Much Land is Needed to Power the U.S. with Solar?
How Much Land is Needed to Power the U.S. with Solar?
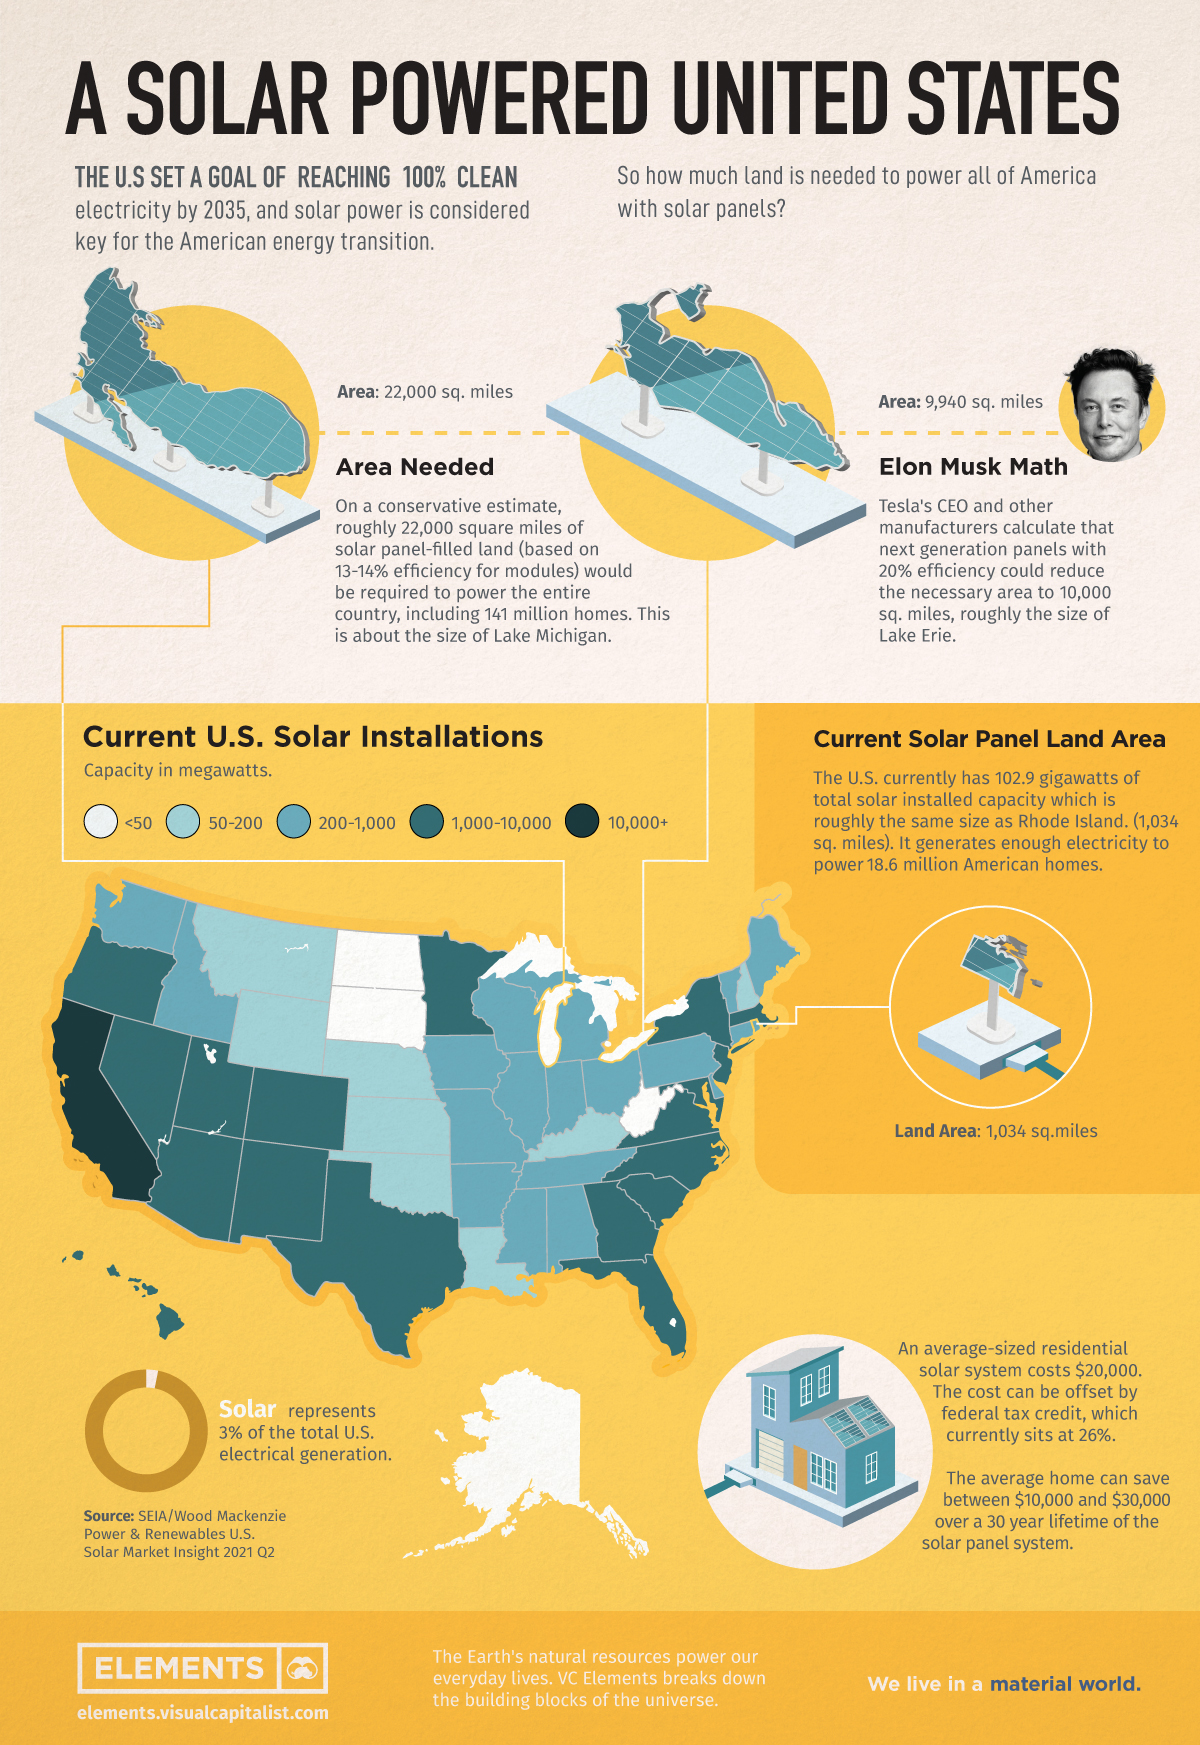
The Biden administration has set a goal of reaching 100% clean electricity throughout the U.S. by 2035, and solar power is a key for this American energy transition.
In the last decade alone, solar has experienced an average annual growth rate of 42% in the U.S. thanks to federal tax credits, declining costs, and increasing demand. It is projected that more than one in seven American homes will have a solar power system by 2030.
To put this trend into perspective, this graphic uses data from the United States Department of Energy to see how much land would be needed to power the entire country with solar panels.
Solar Panels Across the Ocean State
The U.S. has 102.9 gigawatts of total solar installed capacity which is equivalent to 965 square miles, roughly the size of the country’s smallest state, Rhode Island. This current solar capacity generates enough electricity to power 18.6 million American homes, which is nearly 13% of the nation’s households.
According to a report from the National Renewable Energy Laboratory, roughly 22,000 square miles of solar panel-filled land (about the size of Lake Michigan) would be required to power the entire country, including all 141 million households and businesses, based on 13-14% efficiency for solar modules.
Many solar panels, however, reach 20% efficiency, which could reduce the necessary area to just about 10,000 square miles, equivalent to the size of Lake Erie.
Solar Installations Spreading Across the States
Today, solar represents only 3% of the total U.S. electrical generation.
While California has traditionally dominated the market, other states like Florida and Texas are expanding rapidly, boosted by the residential market.
Large companies with clean energy goals such as Walmart, Apple, Target and Amazon have also helped push solar adoption to near-record levels in 2021.

Despite having a high installation cost, the technology tends to bring savings in the long term. An average-sized residential system has dropped from a price of $40,000 in 2010 to roughly $20,000 in 2020. Along with this, solar panels can save between $10,000-$30,000 over a 30-year lifetime.
Between land and rooftops, the United States has more than enough space to build all the solar panels necessary to power the country. Until then, the future of clean electricity will also depend on hydro, nuclear, geothermal, and wind energy.


Electrification
Ranked: The Top 10 EV Battery Manufacturers in 2023
Asia dominates this ranking of the world’s largest EV battery manufacturers in 2023.

The Top 10 EV Battery Manufacturers in 2023
This was originally posted on our Voronoi app. Download the app for free on iOS or Android and discover incredible data-driven charts from a variety of trusted sources.
Despite efforts from the U.S. and EU to secure local domestic supply, all major EV battery manufacturers remain based in Asia.
In this graphic we rank the top 10 EV battery manufacturers by total battery deployment (measured in megawatt-hours) in 2023. The data is from EV Volumes.
Chinese Dominance
Contemporary Amperex Technology Co. Limited (CATL) has swiftly risen in less than a decade to claim the title of the largest global battery group.
The Chinese company now has a 34% share of the market and supplies batteries to a range of made-in-China vehicles, including the Tesla Model Y, SAIC’s MG4/Mulan, and Li Auto models.
| Company | Country | 2023 Production (megawatt-hour) | Share of Total Production |
|---|---|---|---|
| CATL | 🇨🇳China | 242,700 | 34% |
| BYD | 🇨🇳China | 115,917 | 16% |
| LG Energy Solution | 🇰🇷Korea | 108,487 | 15% |
| Panasonic | 🇯🇵Japan | 56,560 | 8% |
| SK On | 🇰🇷Korea | 40,711 | 6% |
| Samsung SDI | 🇰🇷Korea | 35,703 | 5% |
| CALB | 🇨🇳China | 23,493 | 3% |
| Farasis Energy | 🇨🇳China | 16,527 | 2% |
| Envision AESC | 🇨🇳China | 8,342 | 1% |
| Sunwoda | 🇨🇳China | 6,979 | 1% |
| Other | - | 56,040 | 8% |
In 2023, BYD surpassed LG Energy Solution to claim second place. This was driven by demand from its own models and growth in third-party deals, including providing batteries for the made-in-Germany Tesla Model Y, Toyota bZ3, Changan UNI-V, Venucia V-Online, as well as several Haval and FAW models.
The top three battery makers (CATL, BYD, LG) collectively account for two-thirds (66%) of total battery deployment.
Once a leader in the EV battery business, Panasonic now holds the fourth position with an 8% market share, down from 9% last year. With its main client, Tesla, now effectively sourcing batteries from multiple suppliers, the Japanese battery maker seems to be losing its competitive edge in the industry.
Overall, the global EV battery market size is projected to grow from $49 billion in 2022 to $98 billion by 2029, according to Fortune Business Insights.
Electrification
White Gold: Mapping U.S. Lithium Mines
In this graphic, Visual Capitalist partnerered with EnergyX to explore the size and location of U.S. lithium mines.

White Gold: Mapping U.S. Lithium Mines
The U.S. doubled imports of lithium-ion batteries for the third consecutive year in 2022, and with EV demand growing yearly, U.S. lithium mines must ramp up production or rely on other nations for their supply of refined lithium.
To determine if the domestic U.S. lithium opportunity can meet demand, we partnered with EnergyX to determine how much lithium sits within U.S. borders.
U.S. Lithium Projects
The most crucial measure of a lithium mine’s potential is the quantity that can be extracted from the source.
For each lithium resource, the potential volume of lithium carbonate equivalent (LCE) was calculated with a ratio of one metric ton of lithium producing 5.32 metric tons of LCE. Cumulatively, existing U.S. lithium projects contain 94.8 million metric tons of LCE.
| Rank | Project Name | LCE, million metric tons (est.) |
|---|---|---|
| 1 | McDermitt Caldera | 21.5 |
| 2 | Thacker Pass | 19.1 |
| 3 | Tonopah Flats | 18.0 |
| 4 | TLC Lithium | 10.7 |
| 5 | Clayton Valley (Century Lithium) | 6.3 |
| 6 | Zeus Lithium | 6.3 |
| 7 | Rhyolite Ridge | 3.4 |
| 8 | Arkansas Smackover (Phase 1A) | 2.8 |
| 9 | Basin Project | 2.2 |
| 10 | McGee Deposit | 2.1 |
| 11 | Arkansas Smackover (South West) | 1.8 |
| 12 | Clayton Valley (Lithium-X, Pure Energy) | 0.8 |
| 13 | Big Sandy | 0.3 |
| 14 | Imperial Valley/Salton Sea | 0.3 |
U.S. Lithium Opportunities, By State
U.S. lithium projects mainly exist in western states, with comparatively minor opportunities in central or eastern states.
| State | LCE, million metric tons (est.) |
|---|---|
| Nevada | 88.2 |
| Arkansas | 4.6 |
| Arizona | 2.5 |
| California | 0.3 |
Currently, the U.S. is sitting on a wealth of lithium that it is underutilizing. For context, in 2022, the U.S. only produced about 5,000 metric tons of LCE and imported a projected 19,000 metric tons of LCE, showing that the demand for the mineral is healthy.
The Next Gold Rush?
U.S. lithium companies have the opportunity to become global leaders in lithium production and accelerate the transition to sustainable energy sources. This is particularly important as the demand for lithium is increasing every year.
EnergyX is on a mission to meet U.S. lithium demands using groundbreaking technology that can extract 300% more lithium from a source than traditional methods.
You can take advantage of this opportunity by investing in EnergyX and joining other significant players like GM in becoming a shareholder.


-

 Electrification3 years ago
Ranked: The Top 10 EV Battery Manufacturers
-

 Electrification2 years ago
The Key Minerals in an EV Battery
-

 Real Assets3 years ago
The World’s Top 10 Gold Mining Companies
-

 Misc3 years ago
All the Metals We Mined in One Visualization
-

 Electrification3 years ago
The Biggest Mining Companies in the World in 2021
-

 Energy Shift2 years ago
What Are the Five Major Types of Renewable Energy?
-

 Electrification2 years ago
Mapped: Solar Power by Country in 2021
-

 Electrification2 years ago
The World’s Largest Nickel Mining Companies