

Real Assets
Getting Gold Exposure: Bullion vs. ETFs vs. Mining Stocks
How to Get Gold Exposure in Your Portfolio, Explained
A lot of talking heads say, “Buy gold!” but don’t really explain exactly how to buy gold or get exposure to the precious metal.
There are options when it comes to getting exposure to the precious metal, and each one has upsides and downsides worth being mindful of.
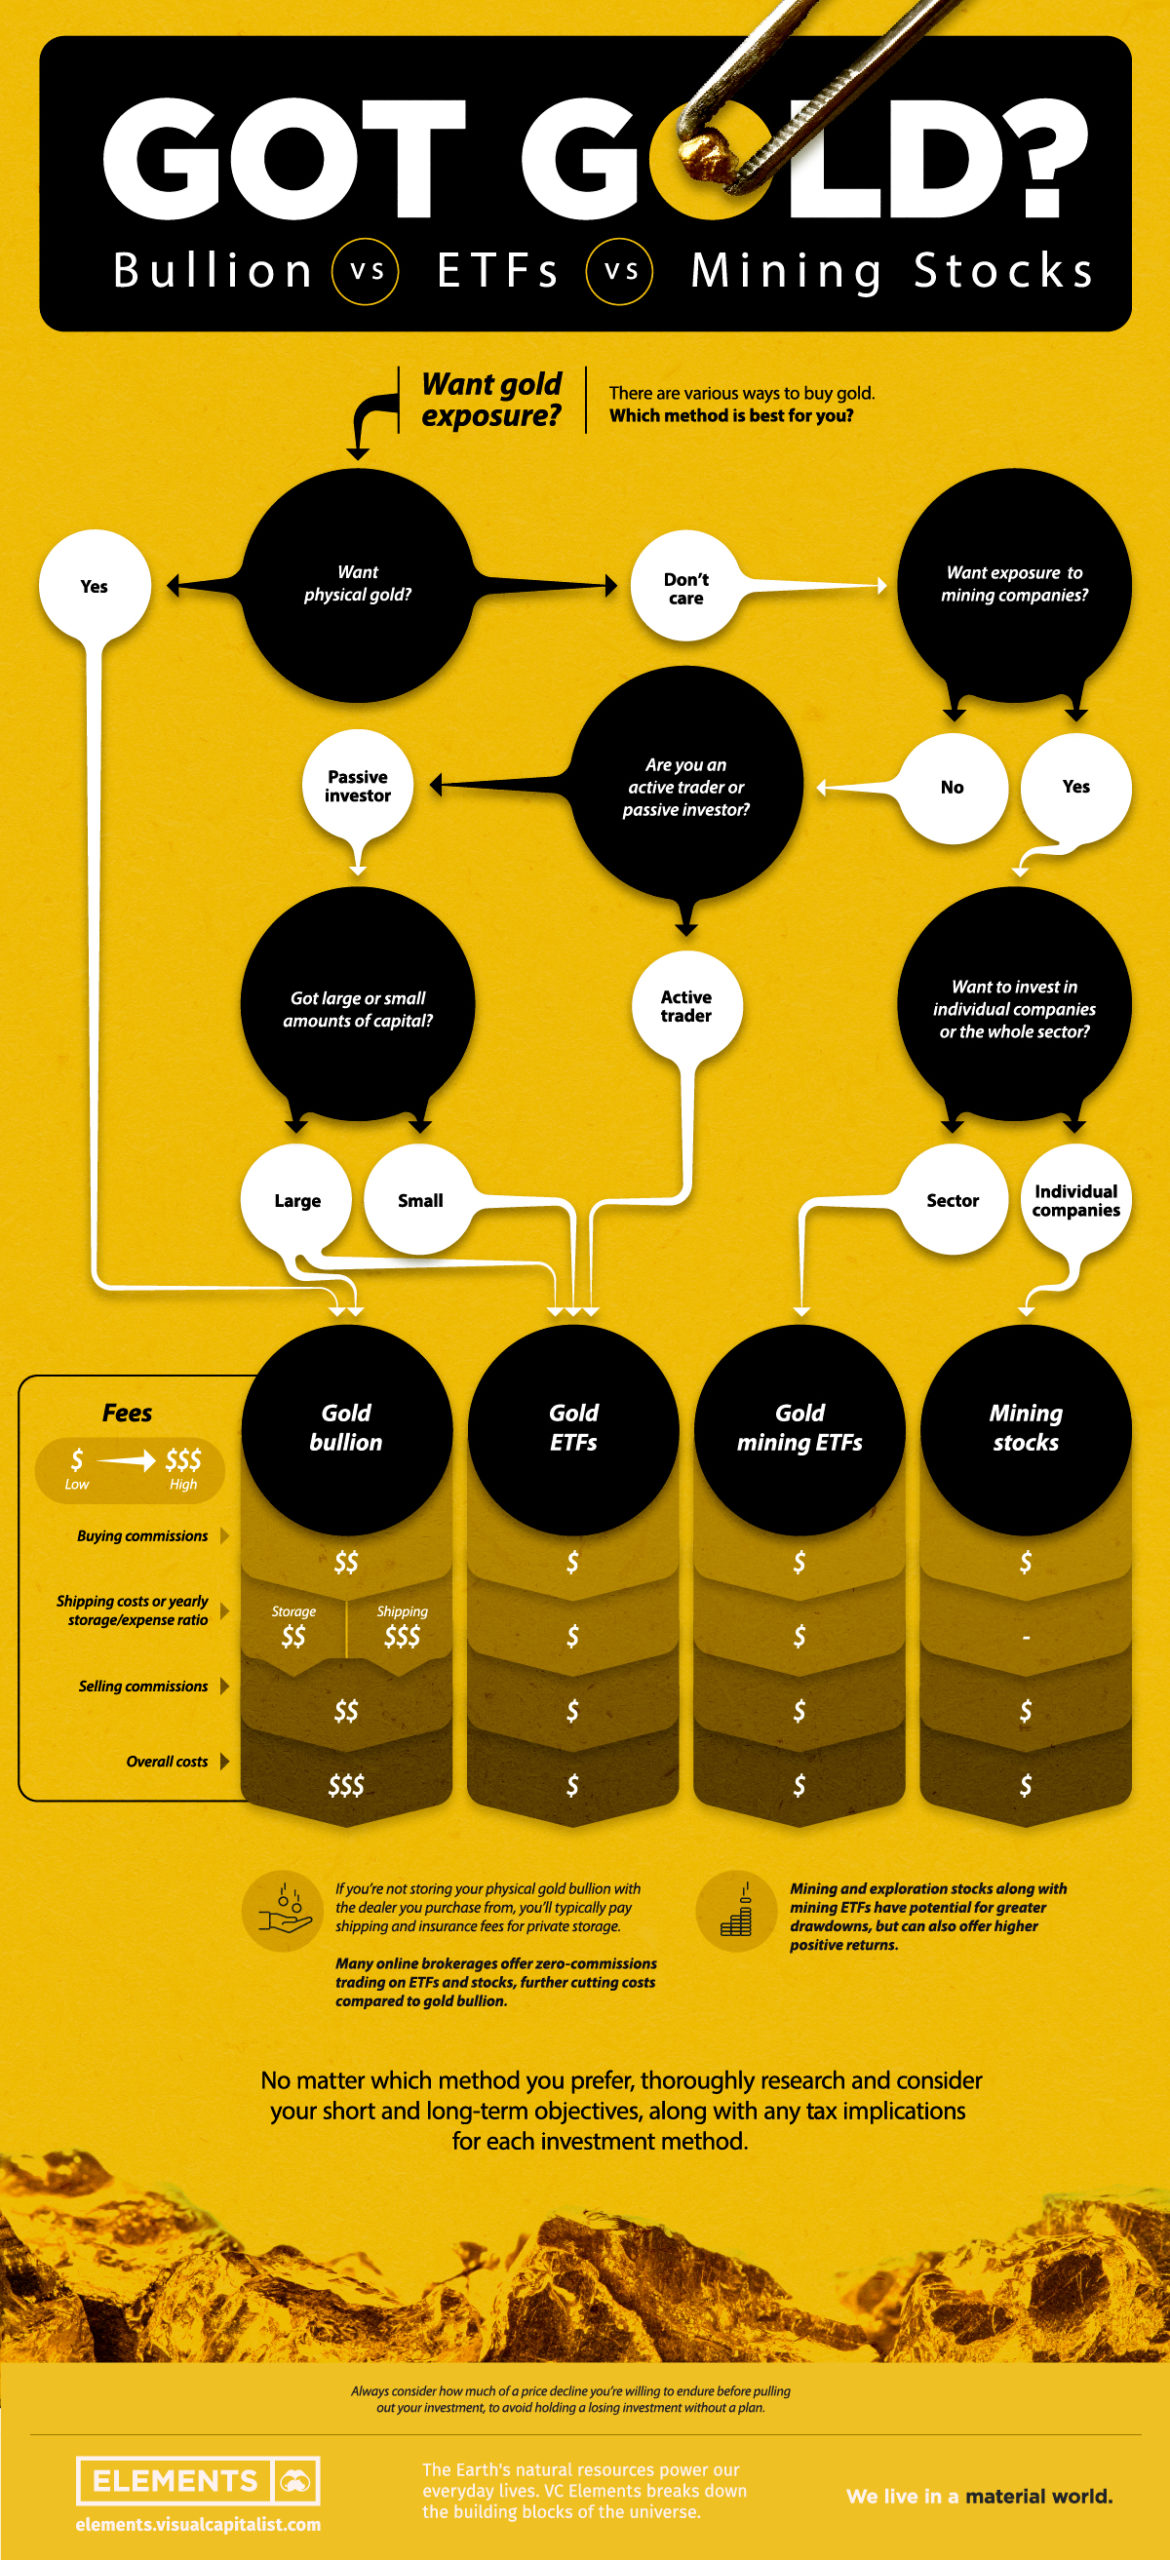
Whether you’re interested in holding physical gold in a safe storage space or simply want to add some gold exposure to your investment portfolio, this infographic shows you the differences between gold bullion, gold ETFs, and gold mining stocks.
What to Consider Before Investing in Gold
There are some key considerations to be aware of before you begin investing.
While below are some of the main factors to keep in mind as you pick a gold investment method, be sure to research each method and its properties thoroughly before investing.
Downside and Volatility Risk
The first consideration for any kind of investment should always be how much drawdown you’re willing to stomach before pulling your money out.
When the COVID-19 pandemic resulted in a price drop across the board for just about every kind of asset, the price of physical gold and gold-backed ETFs held up very differently compared to individual gold mining stocks and gold mining indices.
Case Study: Gold vs. Mining Stocks Drawdown and Returns
| Asset | Drawdown from March high to March low | Returns from March low to 2020 high |
|---|---|---|
| Spot gold and gold ETFs | -14.8% | 42.9% |
| Barrick Gold Corporation | -42.1% | 146.8% |
| Gold Miners ETF (GDX) | -46.0% | 182.9% |
| Junior Gold Miners ETF (GDXJ) | -52.7% | 237.9% |
While physical gold and bullion ETFs (which track gold’s price movements) tend to be more resilient during market downturns, they also offer less upside compared to gold mining stocks and indices during bull markets.
Junior miners or exploration companies offer the greatest volatility and potential upside, but carry the highest risk. When investing in any mining company, concrete results from their planning and drilling along with efficient execution in setting up projects and production will best determine the stock’s valuation.
Active vs. Passive Management
Some investors like to actively manage their investments while others prefer a more passive “set and forget” approach.
Each approach has its merits, however, gold ETFs and mining stocks are better suited for more active investors, while shipping and transport costs for physical gold can add up if buying and selling frequently.
Determine whether you’re going to be actively managing your gold exposure or if you’re going to be letting your investment sit for a while. This way you can determine the best method to reduce fees and commissions.
Three Types of Gold Exposure: Pros and Cons
Now, let’s dive into the three main types of gold exposure: gold bullion, gold ETFs, and gold mining stocks and ETFs.
1. Gold Bullion
If you’re looking to purchase physical gold in the form of bullion, there are a lot of considerations to keep in mind. These range from the various fees you’ll pay to where and how you’ll be storing and protecting your gold.
Many bullion dealers offer storage as a service, reducing shipping costs and the extra work of finding somewhere secure to keep your gold.
Fixed Position Sizes and Liquidity
When buying gold bullion it’s important to remember that you are buying coins, bars, or ingots of gold. This means that if you’re looking to sell off half of your gold position but only have a single 1oz gold coin, you won’t be able to!
Due to this, gold bullion might not be the best option for those interested in actively managing their exposure or for those with smaller amounts of capital.
Buying and Selling Commissions
Just about every gold dealer will charge commissions on any buying or selling, which are typically <1% of the value of the order with lower commissions for larger volumes. Some dealers include their commissions as a premium directly onto their prices.
Storage Costs
Storing gold bullion with gold dealers or storage services will incur yearly storage costs that are typically a percentage of your holdings.
While some storage providers have low percentages, they will often have minimum monthly or yearly storage fees. For investors purchasing small amounts of gold it’s important to not let these fees eat up too much of your investment.
- Fees range from 0.12% to 1.5% annually, with some storage services providing fee discounts for larger volumes of gold
- While purchases of investment-grade bullion are tax-exempt, taxes are charged on storage fees.
Reputable gold storage services offer full insurance coverage on your bullion stored with them and will keep your gold physically separate from the company’s gold and off the company balance sheet. Some will even provide customers extra peace of mind with pictures of their bullion, typically for an additional cost.
Withdrawal Commissions and Shipping
If you’ve been storing your gold with a dealer but want it closer to home, you’ll have to pay withdrawal commissions along with shipping costs. Some dealers charge a flat rate per bullion or withdrawal, while others charge a percentage of your holdings.
If you’re having bullion sent to you without storing it at the dealer, you’ll just pay for shipping and insurance. These are typically flat fees along with a percentage of the dollar value of your order (ranging from 0.4% to 7.5% depending on the amount and types of bullion).
Before holding your gold privately it’s important to know:
- Privately held gold is sometimes not fully trusted when sold back to bullion markets, and can lose some of its value.
- Privately held gold is usually less physically safe compared to gold in a vault, and is almost always more expensive to insure.
2. Gold ETFs
Exchange-traded funds (ETFs) are a more approachable option to get exposure to gold for those with some experience purchasing shares using online brokers and exchanges.
Gold ETFs enable investors to have exposure to gold’s price while avoiding storage, shipping, and insurance fees. There are also fewer liquidity bottlenecks and tighter spreads with gold ETFs compared to gold bullion.
When buying gold ETFs it is important to remember that in most cases, you never actually own any physical gold. Even though these funds are backed by physical gold, you cannot redeem your shares in exchange for gold.
- Buying and Selling Commissions: When buying or selling shares of an ETF you’ll likely pay commissions. These commissions are decided by the brokerages and are typically below $10 per buy and sell order, with some brokerages offering commission-free trading to cut costs for active traders.
- Expense Ratios: Similar to storage fees on gold bullion kept in a vault, gold ETFs charge a yearly expense ratio to cover the costs of management and operations. Expense ratios are typically quite low, ranging from 0.17% to 0.75%, and are taken directly from your investment.
3. Gold Mining Stocks and ETFs
Gold mining stocks and mining ETFs are the most distant from physical gold, and offer exposure to the operating profits, losses, or even discoveries of mining or exploration companies.
Mining ETFs (like the GDX and GDXJ) are a basket of mining stocks for purchase as a single share, helping spread out the operational and concentration risk of investing in a single mining company. Mining ETFs are typically less volatile than individual mining stocks, but can still offer increased returns compared to gold bullion and gold ETFs.
Similar to gold ETFs, mining stocks and mining ETFs have:
- Buying and selling commissions decided by your online brokerage
- Annual expense ratios for mining ETFs
- Potential for dividends depending on the individual mining stock
If buying individual gold stocks, it is important to know that the prospects of any one company can differ incredibly. For this reason, it’s crucial to invest in quality companies, and to have an understanding at factors at play such as management competence, jurisdiction, or project quality and economics.
Find a Gold Investment Method that Works Best for You
Be aware that the methods discussed in this article aren’t the only ways to invest in gold.
If you’re willing to learn a bit more about contract structures and more complex fee structures, look into gold futures contracts. For those with some options understanding and experience, buying call options is another way to get gold exposure. Rare coins and jewelry are another investment method that also carries some artistic value.
Whatever you pick, make sure to thoroughly research your investment, its transaction and price mechanisms, and the commissions and fees you’ll be paying.
All of the investment methods discussed have differing tax implications depending on where you reside, which could influence your decision on how you invest in gold.


Real Assets
Charted: The Value Gap Between the Gold Price and Gold Miners
While gold prices hit all-time highs, gold mining stocks have lagged far behind.

Gold Price vs. Gold Mining Stocks
This was originally posted on our Voronoi app. Download the app for free on Apple or Android and discover incredible data-driven charts from a variety of trusted sources.
Although the price of gold has reached new record highs in 2024, gold miners are still far from their 2011 peaks.
In this graphic, we illustrate the evolution of gold prices since 2000 compared to the NYSE Arca Gold BUGS Index (HUI), which consists of the largest and most widely held public gold production companies. The data was compiled by Incrementum AG.
Mining Stocks Lag Far Behind
In April 2024, gold reached a new record high as Federal Reserve Chair Jerome Powell signaled policymakers may delay interest rate cuts until clearer signs of declining inflation materialize.
Additionally, with elections occurring in more than 60 countries in 2024 and ongoing conflicts in Ukraine and Gaza, central banks are continuing to buy gold to strengthen their reserves, creating momentum for the metal.
Traditionally known as a hedge against inflation and a safe haven during times of political and economic uncertainty, gold has climbed over 11% so far this year.
According to Business Insider, gold miners experienced their best performance in a year in March 2024. During that month, the gold mining sector outperformed all other U.S. industries, surpassing even the performance of semiconductor stocks.
Still, physical gold has outperformed shares of gold-mining companies over the past three years by one of the largest margins in decades.
| Year | Gold Price | NYSE Arca Gold BUGS Index (HUI) |
|---|---|---|
| 2023 | $2,062.92 | $243.31 |
| 2022 | $1,824.32 | $229.75 |
| 2021 | $1,828.60 | $258.87 |
| 2020 | $1,895.10 | $299.64 |
| 2019 | $1,523.00 | $241.94 |
| 2018 | $1,281.65 | $160.58 |
| 2017 | $1,296.50 | $192.31 |
| 2016 | $1,151.70 | $182.31 |
| 2015 | $1,060.20 | $111.18 |
| 2014 | $1,199.25 | $164.03 |
| 2013 | $1,201.50 | $197.70 |
| 2012 | $1,664.00 | $444.22 |
| 2011 | $1,574.50 | $498.73 |
| 2010 | $1,410.25 | $573.32 |
| 2009 | $1,104.00 | $429.91 |
| 2008 | $865.00 | $302.41 |
| 2007 | $836.50 | $409.37 |
| 2006 | $635.70 | $338.24 |
| 2005 | $513.00 | $276.90 |
| 2004 | $438.00 | $215.33 |
| 2003 | $417.25 | $242.93 |
| 2002 | $342.75 | $145.12 |
| 2001 | $276.50 | $65.20 |
| 2000 | $272.65 | $40.97 |
Among the largest companies on the NYSE Arca Gold BUGS Index, Colorado-based Newmont has experienced a 24% drop in its share price over the past year. Similarly, Canadian Barrick Gold also saw a decline of 6.5% over the past 12 months.
Real Assets
200 Years of Global Gold Production, by Country
Global gold production has grown exponentially since the 1800s, with 86% of all above-ground gold mined in the last 200 years.


Visualizing Global Gold Production Over 200 Years
Although the practice of gold mining has been around for thousands of years, it’s estimated that roughly 86% of all above-ground gold was extracted in the last 200 years.
With modern mining techniques making large-scale production possible, global gold production has grown exponentially since the 1800s.
The above infographic uses data from Our World in Data to visualize global gold production by country from 1820 to 2022, showing how gold mining has evolved to become increasingly global over time.
A Brief History of Gold Mining
The best-known gold rush in modern history occurred in California in 1848, when James Marshall discovered gold in Sacramento Valley. As word spread, thousands of migrants flocked to California in search of gold, and by 1855, miners had extracted around $2 billion worth of gold.
The United States, Australia, and Russia were (interchangeably) the three largest gold producers until the 1890s. Then, South Africa took the helm thanks to the massive discovery in the Witwatersrand Basin, now regarded today as one of the world’s greatest ever goldfields.
South Africa’s annual gold production peaked in 1970 at 1,002 tonnes—by far the largest amount of gold produced by any country in a year.
With the price of gold rising since the 1980s, global gold production has become increasingly widespread. By 2007, China was the world’s largest gold-producing nation, and today a significant quantity of gold is being mined in over 40 countries.
The Top Gold-Producing Countries in 2022
Around 31% of the world’s gold production in 2022 came from three countries—China, Russia, and Australia, with each producing over 300 tonnes of the precious metal.
| Rank | Country | 2022E Gold Production, tonnes | % of Total |
|---|---|---|---|
| #1 | 🇨🇳 China | 330 | 11% |
| #2 | 🇷🇺 Russia | 320 | 10% |
| #3 | 🇦🇺 Australia | 320 | 10% |
| #4 | 🇨🇦 Canada | 220 | 7% |
| #5 | 🇺🇸 United States | 170 | 5% |
| #6 | 🇲🇽 Mexico | 120 | 4% |
| #7 | 🇰🇿 Kazakhstan | 120 | 4% |
| #8 | 🇿🇦 South Africa | 110 | 4% |
| #9 | 🇵🇪 Peru | 100 | 3% |
| #10 | 🇺🇿 Uzbekistan | 100 | 3% |
| #11 | 🇬🇭 Ghana | 90 | 3% |
| #12 | 🇮🇩 Indonesia | 70 | 2% |
| - | 🌍 Rest of the World | 1,030 | 33% |
| - | World Total | 3,100 | 100% |
North American countries Canada, the U.S., and Mexico round out the top six gold producers, collectively making up 16% of the global total. The state of Nevada alone accounted for 72% of U.S. production, hosting the world’s largest gold mining complex (including six mines) owned by Nevada Gold Mines.
Meanwhile, South Africa produced 110 tonnes of gold in 2022, down by 74% relative to its output of 430 tonnes in 2000. This long-term decline is the result of mine closures, maturing assets, and industrial conflict, according to the World Gold Council.
Interestingly, two smaller gold producers on the list, Uzbekistan and Indonesia, host the second and third-largest gold mining operations in the world, respectively.
The Outlook for Global Gold Production
As of April 25, gold prices were hovering around the $2,000 per ounce mark and nearing all-time highs. For mining companies, higher gold prices can mean more profits per ounce if costs remain unaffected.
According to the World Gold Council, mined gold production is expected to increase in 2023 and could surpass the record set in 2018 (3,300 tonnes), led by the expansion of existing projects in North America. The chances of record mine output could be higher if gold prices continue to increase.

-

 Electrification3 years ago
Ranked: The Top 10 EV Battery Manufacturers
-

 Electrification2 years ago
The Key Minerals in an EV Battery
-

 Real Assets3 years ago
The World’s Top 10 Gold Mining Companies
-

 Misc3 years ago
All the Metals We Mined in One Visualization
-

 Electrification3 years ago
The Biggest Mining Companies in the World in 2021
-

 Energy Shift2 years ago
What Are the Five Major Types of Renewable Energy?
-

 Electrification2 years ago
Mapped: Solar Power by Country in 2021
-

 Electrification2 years ago
The World’s Largest Nickel Mining Companies