

Real Assets
How the World’s Top Gold Mining Stocks Performed in 2020
How Top Gold Mining Stocks Performed in 2020
Gold mining stocks and the GDX saw strong returns in 2020 as gold was one of the most resilient and best performing assets in a highly volatile year.
But picking gold mining stocks isn’t easy, as each company has a variety of individual projects and risks worth assessing. This is why the GDX (VanEck Vectors Gold Miners ETF), is one of the most popular methods investors choose to get exposure to players in the gold mining industry.
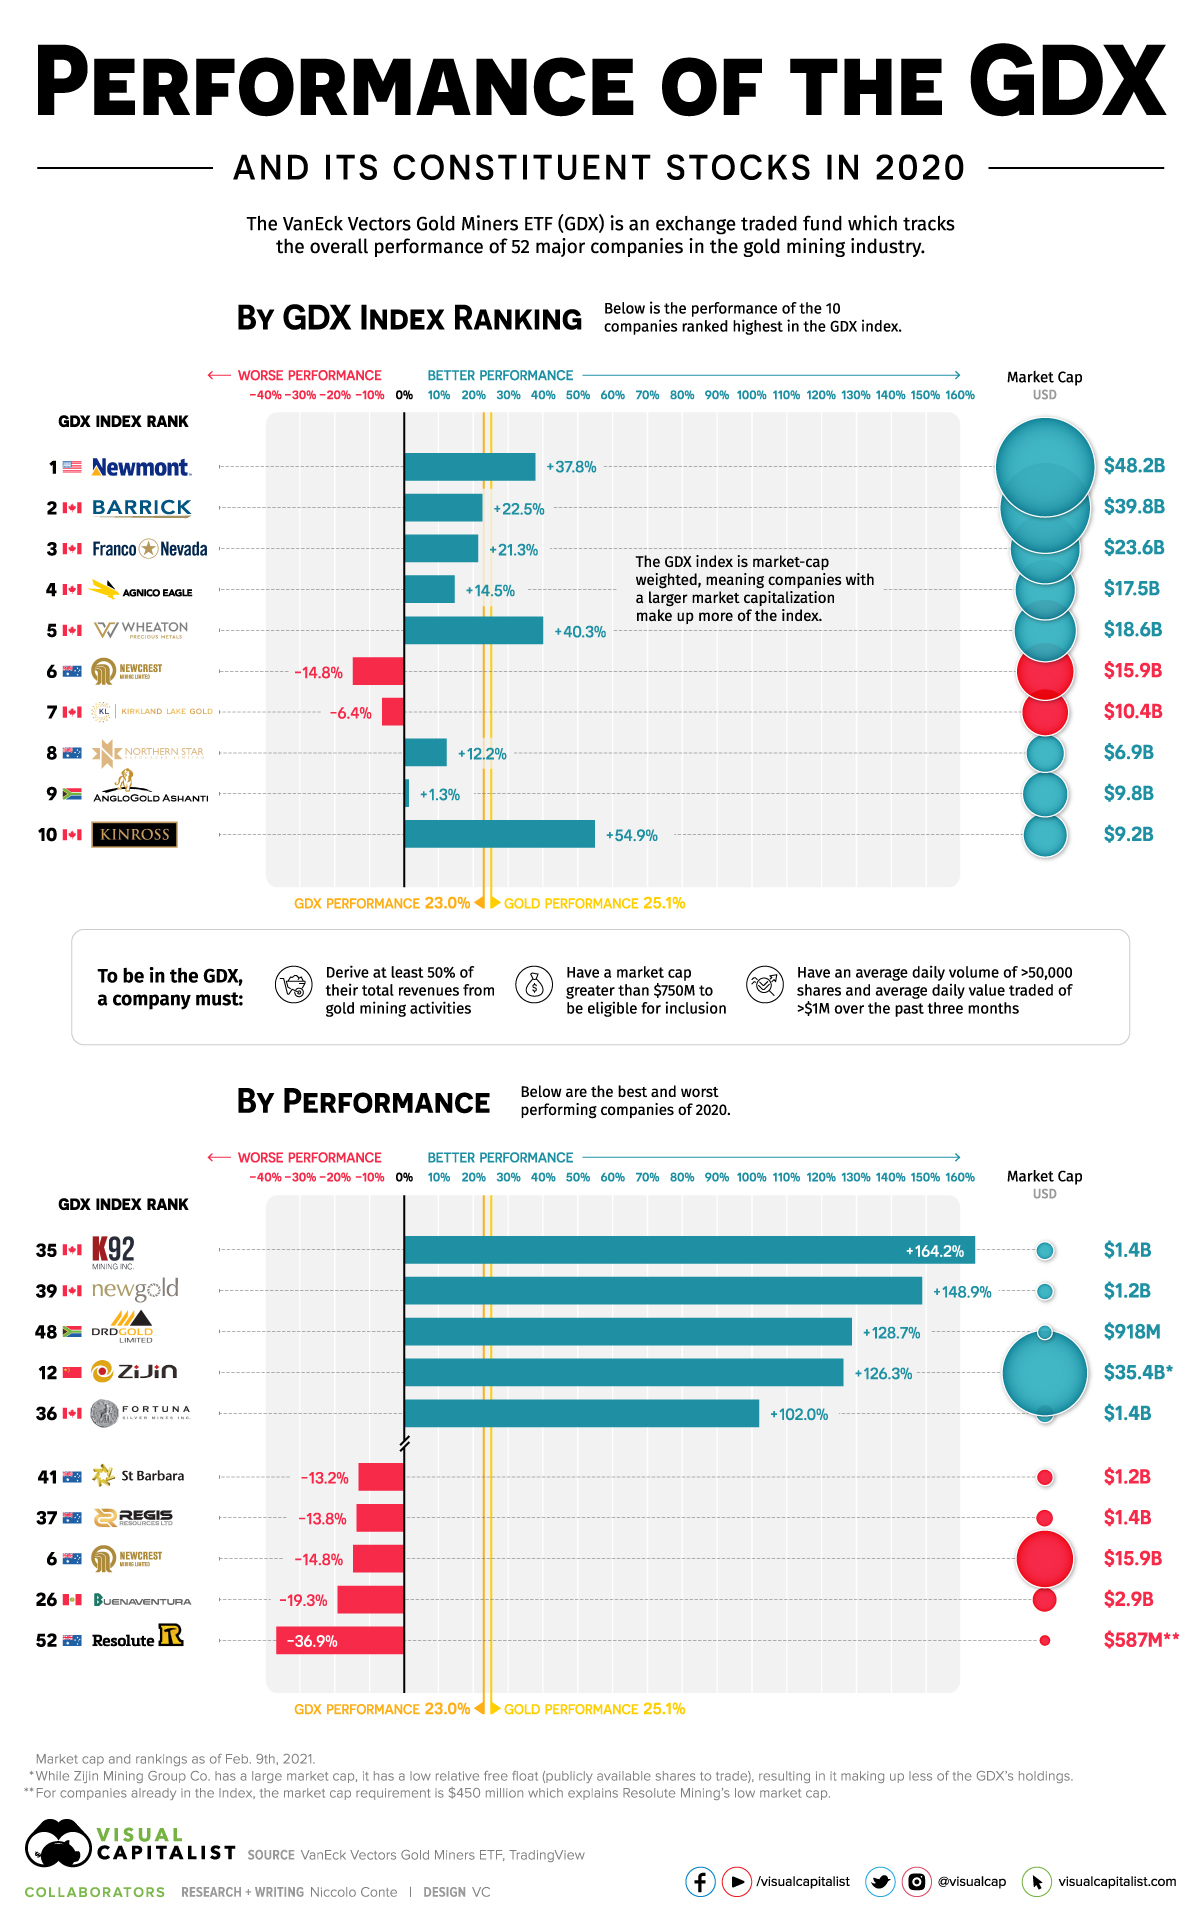
While the GDX and gold miners can generally offer leveraged upside compared to gold during bull markets, in 2020 the GDX returned 23%, just a couple of points shy from spot gold’s 25.1% return.
This graphic compares the returns of gold, the GDX, and the best and worst performing gold mining equities in the index.
Understanding the GDX ETF and its Value
The GDX is one of many index ETFs created by investment management firm VanEck and offers exposure to 52 of the top gold mining stocks.
It provides a straightforward way to invest in the largest names in the gold mining industry, while cutting down on some of the individual risks that many mining companies are exposed to. The GDX is VanEck’s largest and most popular ETF averaging ~$25M in volume every day, with the largest amount of total net assets at $15.3B.
In terms of its holdings, the GDX attempts to replicate the returns of the NYSE Arca Gold Miners Index (GDM), which tracks the overall performance of companies in the gold mining industry.
How the Largest Gold Miners Performed in 2020
As a market-cap weighted ETF, the GDX allocates more assets towards constituents with a higher market cap, resulting in larger gold mining companies making up more of the index’s holdings.
This results in the five largest companies in the GDX making up 39.5% of the index’s holdings, and the top 10 making up 59.3%.
An equally-weighted index of the top five GDX constituents returned 27.3% for the year, outperforming gold and the index by a few points. Meanwhile, an equally-weighted index of the top 10 constituents significantly underperformed, only returning 18.4%.
Newmont was the only company of the top five which outperformed gold and the overall index, returning 37.8% for the year. Wheaton Precious Metals (40.3%) and Kinross Gold (54.9%) were the only other companies in the top 10 that managed to outperform.
Kinross Gold was the best performer among the top constituents largely due to its strong Q3 results, where the company generated significant free cash flow while quadrupling reported net earnings. Along with these positive results, the company also announced its expectation to increase gold production by 20% over the next three years.
The Best and Worst Performers in 2020
Among the best and worst performers of the GDX, it was the smaller-sized companies in the bottom half of the ranking which either significantly over- or underperformed.
K92 Mining’s record gold production from their Kainantu gold mine, along with a significant resource increase at their high-grade Kora deposit nearby saw a return of 164.2%, with the company graduating from the TSX-V to the TSX at the end of 2020.
Four of the five worst performers for 2020 were Australian mining companies as the country entered its first recession in 30 years after severe COVID-19 lockdowns and restrictions. Bushfires early in the year disrupted shipments from Newcrest’s Cadia mine, and rising tensions with China (Australia’s largest trading partner) also contributed to double-digit drawdowns for some Australian gold miners.
The worst performer and last-ranked company in the index, Resolute Mining (-36.9%), had further disruptions in H2’2020 at their Syama gold mine in Mali. The military coup and resignation of Mali’s president Ibrahim Keïta in August was followed by unionized workers threatening strikes in September, slowing operations at Syama gold mine. Outright strikes eventually occurred before year’s end.
How Gold Mining Stocks are Chosen for the GDX
There are some ground rules which dictate how the index is weighted to ensure the GDM and GDX properly reflect the gold mining industry.
Along with the rules on the index’s weighting, there are company-specific requirements for inclusion into the GDM, and as a result the GDX:
- Derive >50% of revenues from gold mining and related activities
- Market capitalization >$750M
- Average daily volume >50,000 shares over the past three months
- Average daily value traded >$1M over the past three months
Gold mining stocks already in the index have some leeway regarding these requirements, and ultimately inclusion or exclusion from the index us up to the Index Administrator.
What 2021 Will Bring for Gold Mining Stocks
The GDX has had a muted start to the new year, with the index at -2.3% as it has mostly followed spot gold’s price.
Gold and gold mining stocks cooled off significantly following their strong rally Q1-Q3’2020, as positive developments regarding the COVID-19 vaccine have resulted in a stronger-than-expected U.S. dollar and a rise in treasury yields.
This being said, the arrival of new monetary stimulus in the U.S. could spur inflation-fearing investors towards gold and gold mining stocks as the year progresses.


Real Assets
Charted: The Value Gap Between the Gold Price and Gold Miners
While gold prices hit all-time highs, gold mining stocks have lagged far behind.

Gold Price vs. Gold Mining Stocks
This was originally posted on our Voronoi app. Download the app for free on Apple or Android and discover incredible data-driven charts from a variety of trusted sources.
Although the price of gold has reached new record highs in 2024, gold miners are still far from their 2011 peaks.
In this graphic, we illustrate the evolution of gold prices since 2000 compared to the NYSE Arca Gold BUGS Index (HUI), which consists of the largest and most widely held public gold production companies. The data was compiled by Incrementum AG.
Mining Stocks Lag Far Behind
In April 2024, gold reached a new record high as Federal Reserve Chair Jerome Powell signaled policymakers may delay interest rate cuts until clearer signs of declining inflation materialize.
Additionally, with elections occurring in more than 60 countries in 2024 and ongoing conflicts in Ukraine and Gaza, central banks are continuing to buy gold to strengthen their reserves, creating momentum for the metal.
Traditionally known as a hedge against inflation and a safe haven during times of political and economic uncertainty, gold has climbed over 11% so far this year.
According to Business Insider, gold miners experienced their best performance in a year in March 2024. During that month, the gold mining sector outperformed all other U.S. industries, surpassing even the performance of semiconductor stocks.
Still, physical gold has outperformed shares of gold-mining companies over the past three years by one of the largest margins in decades.
| Year | Gold Price | NYSE Arca Gold BUGS Index (HUI) |
|---|---|---|
| 2023 | $2,062.92 | $243.31 |
| 2022 | $1,824.32 | $229.75 |
| 2021 | $1,828.60 | $258.87 |
| 2020 | $1,895.10 | $299.64 |
| 2019 | $1,523.00 | $241.94 |
| 2018 | $1,281.65 | $160.58 |
| 2017 | $1,296.50 | $192.31 |
| 2016 | $1,151.70 | $182.31 |
| 2015 | $1,060.20 | $111.18 |
| 2014 | $1,199.25 | $164.03 |
| 2013 | $1,201.50 | $197.70 |
| 2012 | $1,664.00 | $444.22 |
| 2011 | $1,574.50 | $498.73 |
| 2010 | $1,410.25 | $573.32 |
| 2009 | $1,104.00 | $429.91 |
| 2008 | $865.00 | $302.41 |
| 2007 | $836.50 | $409.37 |
| 2006 | $635.70 | $338.24 |
| 2005 | $513.00 | $276.90 |
| 2004 | $438.00 | $215.33 |
| 2003 | $417.25 | $242.93 |
| 2002 | $342.75 | $145.12 |
| 2001 | $276.50 | $65.20 |
| 2000 | $272.65 | $40.97 |
Among the largest companies on the NYSE Arca Gold BUGS Index, Colorado-based Newmont has experienced a 24% drop in its share price over the past year. Similarly, Canadian Barrick Gold also saw a decline of 6.5% over the past 12 months.
Real Assets
200 Years of Global Gold Production, by Country
Global gold production has grown exponentially since the 1800s, with 86% of all above-ground gold mined in the last 200 years.


Visualizing Global Gold Production Over 200 Years
Although the practice of gold mining has been around for thousands of years, it’s estimated that roughly 86% of all above-ground gold was extracted in the last 200 years.
With modern mining techniques making large-scale production possible, global gold production has grown exponentially since the 1800s.
The above infographic uses data from Our World in Data to visualize global gold production by country from 1820 to 2022, showing how gold mining has evolved to become increasingly global over time.
A Brief History of Gold Mining
The best-known gold rush in modern history occurred in California in 1848, when James Marshall discovered gold in Sacramento Valley. As word spread, thousands of migrants flocked to California in search of gold, and by 1855, miners had extracted around $2 billion worth of gold.
The United States, Australia, and Russia were (interchangeably) the three largest gold producers until the 1890s. Then, South Africa took the helm thanks to the massive discovery in the Witwatersrand Basin, now regarded today as one of the world’s greatest ever goldfields.
South Africa’s annual gold production peaked in 1970 at 1,002 tonnes—by far the largest amount of gold produced by any country in a year.
With the price of gold rising since the 1980s, global gold production has become increasingly widespread. By 2007, China was the world’s largest gold-producing nation, and today a significant quantity of gold is being mined in over 40 countries.
The Top Gold-Producing Countries in 2022
Around 31% of the world’s gold production in 2022 came from three countries—China, Russia, and Australia, with each producing over 300 tonnes of the precious metal.
| Rank | Country | 2022E Gold Production, tonnes | % of Total |
|---|---|---|---|
| #1 | 🇨🇳 China | 330 | 11% |
| #2 | 🇷🇺 Russia | 320 | 10% |
| #3 | 🇦🇺 Australia | 320 | 10% |
| #4 | 🇨🇦 Canada | 220 | 7% |
| #5 | 🇺🇸 United States | 170 | 5% |
| #6 | 🇲🇽 Mexico | 120 | 4% |
| #7 | 🇰🇿 Kazakhstan | 120 | 4% |
| #8 | 🇿🇦 South Africa | 110 | 4% |
| #9 | 🇵🇪 Peru | 100 | 3% |
| #10 | 🇺🇿 Uzbekistan | 100 | 3% |
| #11 | 🇬🇭 Ghana | 90 | 3% |
| #12 | 🇮🇩 Indonesia | 70 | 2% |
| - | 🌍 Rest of the World | 1,030 | 33% |
| - | World Total | 3,100 | 100% |
North American countries Canada, the U.S., and Mexico round out the top six gold producers, collectively making up 16% of the global total. The state of Nevada alone accounted for 72% of U.S. production, hosting the world’s largest gold mining complex (including six mines) owned by Nevada Gold Mines.
Meanwhile, South Africa produced 110 tonnes of gold in 2022, down by 74% relative to its output of 430 tonnes in 2000. This long-term decline is the result of mine closures, maturing assets, and industrial conflict, according to the World Gold Council.
Interestingly, two smaller gold producers on the list, Uzbekistan and Indonesia, host the second and third-largest gold mining operations in the world, respectively.
The Outlook for Global Gold Production
As of April 25, gold prices were hovering around the $2,000 per ounce mark and nearing all-time highs. For mining companies, higher gold prices can mean more profits per ounce if costs remain unaffected.
According to the World Gold Council, mined gold production is expected to increase in 2023 and could surpass the record set in 2018 (3,300 tonnes), led by the expansion of existing projects in North America. The chances of record mine output could be higher if gold prices continue to increase.

-

 Electrification3 years ago
Ranked: The Top 10 EV Battery Manufacturers
-

 Electrification2 years ago
The Key Minerals in an EV Battery
-

 Real Assets3 years ago
The World’s Top 10 Gold Mining Companies
-

 Misc3 years ago
All the Metals We Mined in One Visualization
-

 Electrification3 years ago
The Biggest Mining Companies in the World in 2021
-

 Energy Shift2 years ago
What Are the Five Major Types of Renewable Energy?
-

 Electrification2 years ago
Mapped: Solar Power by Country in 2021
-

 Electrification2 years ago
The World’s Largest Nickel Mining Companies