

Electrification
Ranked: Top 25 Nations Producing Battery Metals for the EV Supply Chain
How to Use: Click the arrows on the left/right to navigate between current and projected rankings.
The Role of Mining in the EV Battery Supply Chain
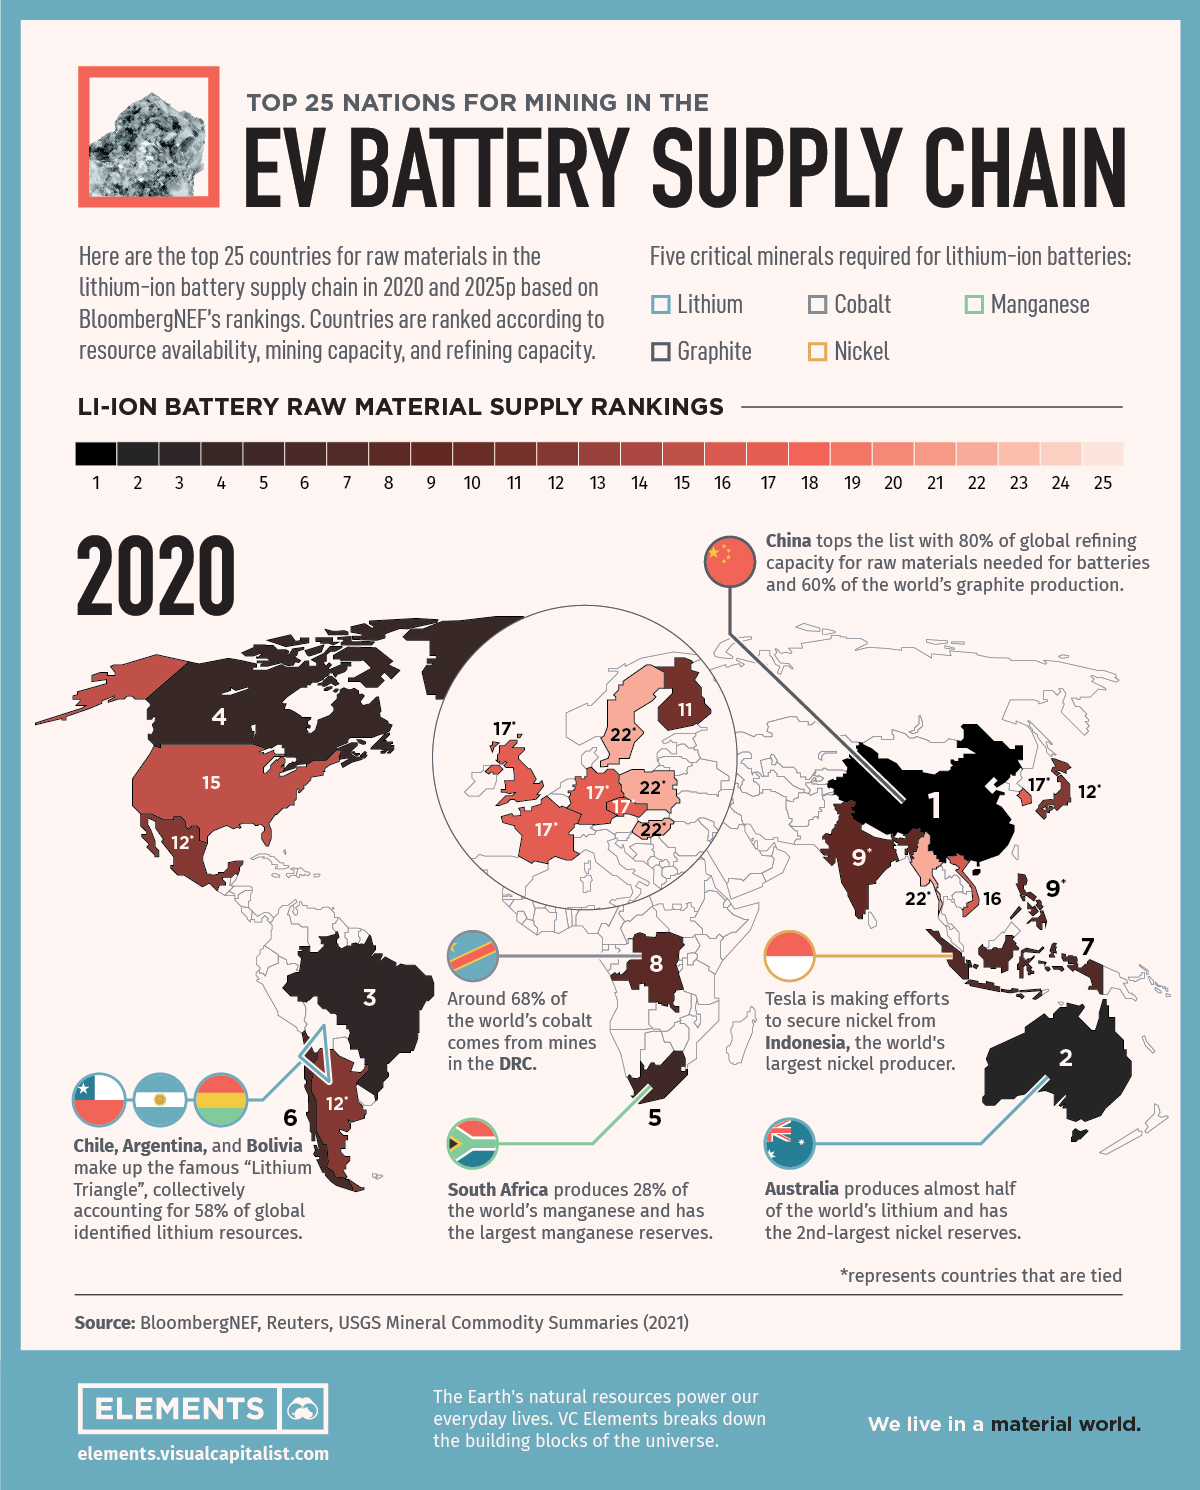
Batteries are one of the most important and expensive components of electric vehicles (EVs). The vast majority of EVs use lithium-ion (Li-ion) batteries, which harness the properties of minerals and elements to power the vehicles. But batteries do not grow on trees—the raw materials for them, known as “battery metals”, have to be mined and refined.
The above graphic uses data from BloombergNEF to rank the top 25 countries producing the raw materials for Li-ion batteries.
Battery Metals: The Critical Raw Materials for EV Batteries
The raw materials that batteries use can differ depending on their chemical compositions. However, there are five battery minerals that are considered critical for Li-ion batteries:
- Cobalt
- Graphite
- Lithium
- Manganese
- Nickel
Miners extract these minerals from economically viable deposits and refine them from their raw forms into high-quality products and chemicals for EV batteries.
The Top 25 Nations Supplying Battery Metals
Some countries are more crucial than others to the battery metal supply chain. BloombergNEF ranked the top 25 countries according to the following methodology:
- First, they tallied the mineral resources, mining capacity, and refining capacity in 2020 and projected commissioned capacity by 2025 for the five key metals listed above in each country.
- Then, to determine the overall score for each country, BloombergNEF categorized the countries’ capacities into five bands. Countries in the lowest band received a score of 1 and those in the highest band received a score of 5.
- The overall score is the result of averaging the scores across the five categories for each country.
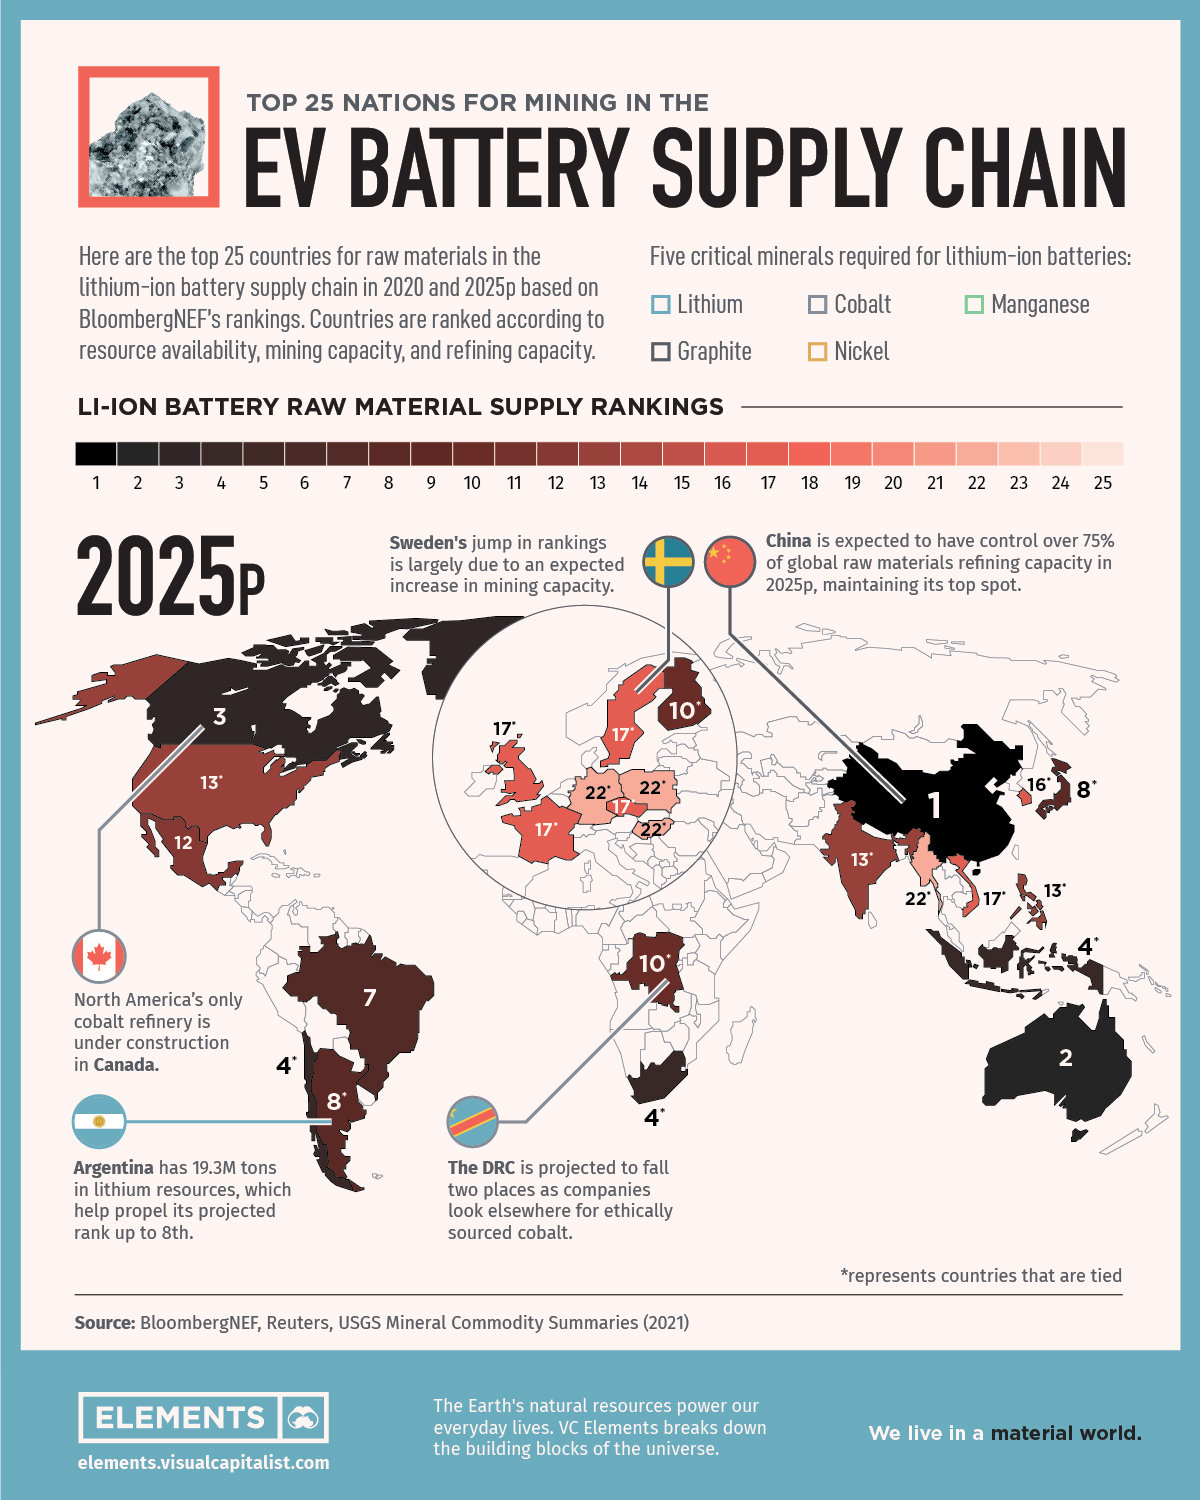
Now that we have a better understanding of how the rankings work, here are the top 25 nations for raw materials in the Li-ion supply chain in 2020 and 2025.
| Country | 2020 Rank | 2025 Projected Rank | Change in Rank |
|---|---|---|---|
| China | 1 | 1 | 0 |
| Australia | 2 | 2 | 0 |
| Brazil | 3 | 7 | -4 |
| Canada | 4 | 3 | +1 |
| South Africa | 5 | 4 | +1 |
| Chile | 6 | 4 | +2 |
| Indonesia | 7 | 4 | +3 |
| Democratic Republic of Congo (DRC) | 8 | 10 | -2 |
| India | 9 | 13 | -4 |
| Philippines | 9 | 13 | -4 |
| Finland | 11 | 10 | +1 |
| Japan | 12 | 8 | +4 |
| Argentina | 12 | 8 | +4 |
| Mexico | 12 | 12 | 0 |
| U.S. | 15 | 13 | +2 |
| Vietnam | 16 | 17 | -1 |
| South Korea | 17 | 16 | +1 |
| Germany | 17 | 22 | -5 |
| U.K. | 17 | 17 | 0 |
| France | 17 | 17 | 0 |
| Czech Republic | 17 | 17 | 0 |
| Sweden | 22 | 17 | +5 |
| Poland | 22 | 22 | 0 |
| Hungary | 22 | 22 | 0 |
| Thailand | 22 | 22 | 0 |
China’s dominance in the rankings shows that refining capacity is just as important, if not more, as access to raw materials and mining capacity.
China does not boast an abundance of battery metal deposits but ranks first largely due to its control over 80% of global raw material refining capacity. Additionally, China is the world’s largest producer of graphite, the primary anode material for Li-ion batteries.
Australia comes in at number two due to its massive lithium production capacity and nickel reserves. Following Australia is Brazil, one of the world’s top 10 producers of graphite, nickel, manganese, and lithium.
On the other end of the spectrum, Poland, Hungary, Sweden, and Thailand are tied at rank 22. However, it’s important to note that these are among the top 10 countries for cell and component manufacturing—the next step in the lithium-ion battery supply chain.
Countries on the Rise
Sweden’s rank rises five places between 2020 and 2025p, largely due to an expected increase in its mining capacity with nickel and graphite projects in the pipeline. Argentina is projected to jump up to eighth place thanks to its massive lithium resources and multiple mining projects in advanced stages.
Moreover, Japan is projected to move up four places with its first lithium hydroxide refining plant under construction. In addition, Japanese miner Sumitomo Metal Mining is planning to double battery metal production by 2028.
Although China will likely maintain its dominance for the foreseeable future, other countries are ramping up their mining and refining capacities. Given the increasing importance of EVs, it will be interesting to see how the battery metals supply chain evolves going forward.


Electrification
Ranked: The Top 10 EV Battery Manufacturers in 2023
Asia dominates this ranking of the world’s largest EV battery manufacturers in 2023.

The Top 10 EV Battery Manufacturers in 2023
This was originally posted on our Voronoi app. Download the app for free on iOS or Android and discover incredible data-driven charts from a variety of trusted sources.
Despite efforts from the U.S. and EU to secure local domestic supply, all major EV battery manufacturers remain based in Asia.
In this graphic we rank the top 10 EV battery manufacturers by total battery deployment (measured in megawatt-hours) in 2023. The data is from EV Volumes.
Chinese Dominance
Contemporary Amperex Technology Co. Limited (CATL) has swiftly risen in less than a decade to claim the title of the largest global battery group.
The Chinese company now has a 34% share of the market and supplies batteries to a range of made-in-China vehicles, including the Tesla Model Y, SAIC’s MG4/Mulan, and Li Auto models.
| Company | Country | 2023 Production (megawatt-hour) | Share of Total Production |
|---|---|---|---|
| CATL | 🇨🇳China | 242,700 | 34% |
| BYD | 🇨🇳China | 115,917 | 16% |
| LG Energy Solution | 🇰🇷Korea | 108,487 | 15% |
| Panasonic | 🇯🇵Japan | 56,560 | 8% |
| SK On | 🇰🇷Korea | 40,711 | 6% |
| Samsung SDI | 🇰🇷Korea | 35,703 | 5% |
| CALB | 🇨🇳China | 23,493 | 3% |
| Farasis Energy | 🇨🇳China | 16,527 | 2% |
| Envision AESC | 🇨🇳China | 8,342 | 1% |
| Sunwoda | 🇨🇳China | 6,979 | 1% |
| Other | - | 56,040 | 8% |
In 2023, BYD surpassed LG Energy Solution to claim second place. This was driven by demand from its own models and growth in third-party deals, including providing batteries for the made-in-Germany Tesla Model Y, Toyota bZ3, Changan UNI-V, Venucia V-Online, as well as several Haval and FAW models.
The top three battery makers (CATL, BYD, LG) collectively account for two-thirds (66%) of total battery deployment.
Once a leader in the EV battery business, Panasonic now holds the fourth position with an 8% market share, down from 9% last year. With its main client, Tesla, now effectively sourcing batteries from multiple suppliers, the Japanese battery maker seems to be losing its competitive edge in the industry.
Overall, the global EV battery market size is projected to grow from $49 billion in 2022 to $98 billion by 2029, according to Fortune Business Insights.
Electrification
White Gold: Mapping U.S. Lithium Mines
In this graphic, Visual Capitalist partnerered with EnergyX to explore the size and location of U.S. lithium mines.

White Gold: Mapping U.S. Lithium Mines
The U.S. doubled imports of lithium-ion batteries for the third consecutive year in 2022, and with EV demand growing yearly, U.S. lithium mines must ramp up production or rely on other nations for their supply of refined lithium.
To determine if the domestic U.S. lithium opportunity can meet demand, we partnered with EnergyX to determine how much lithium sits within U.S. borders.
U.S. Lithium Projects
The most crucial measure of a lithium mine’s potential is the quantity that can be extracted from the source.
For each lithium resource, the potential volume of lithium carbonate equivalent (LCE) was calculated with a ratio of one metric ton of lithium producing 5.32 metric tons of LCE. Cumulatively, existing U.S. lithium projects contain 94.8 million metric tons of LCE.
| Rank | Project Name | LCE, million metric tons (est.) |
|---|---|---|
| 1 | McDermitt Caldera | 21.5 |
| 2 | Thacker Pass | 19.1 |
| 3 | Tonopah Flats | 18.0 |
| 4 | TLC Lithium | 10.7 |
| 5 | Clayton Valley (Century Lithium) | 6.3 |
| 6 | Zeus Lithium | 6.3 |
| 7 | Rhyolite Ridge | 3.4 |
| 8 | Arkansas Smackover (Phase 1A) | 2.8 |
| 9 | Basin Project | 2.2 |
| 10 | McGee Deposit | 2.1 |
| 11 | Arkansas Smackover (South West) | 1.8 |
| 12 | Clayton Valley (Lithium-X, Pure Energy) | 0.8 |
| 13 | Big Sandy | 0.3 |
| 14 | Imperial Valley/Salton Sea | 0.3 |
U.S. Lithium Opportunities, By State
U.S. lithium projects mainly exist in western states, with comparatively minor opportunities in central or eastern states.
| State | LCE, million metric tons (est.) |
|---|---|
| Nevada | 88.2 |
| Arkansas | 4.6 |
| Arizona | 2.5 |
| California | 0.3 |
Currently, the U.S. is sitting on a wealth of lithium that it is underutilizing. For context, in 2022, the U.S. only produced about 5,000 metric tons of LCE and imported a projected 19,000 metric tons of LCE, showing that the demand for the mineral is healthy.
The Next Gold Rush?
U.S. lithium companies have the opportunity to become global leaders in lithium production and accelerate the transition to sustainable energy sources. This is particularly important as the demand for lithium is increasing every year.
EnergyX is on a mission to meet U.S. lithium demands using groundbreaking technology that can extract 300% more lithium from a source than traditional methods.
You can take advantage of this opportunity by investing in EnergyX and joining other significant players like GM in becoming a shareholder.


-

 Electrification3 years ago
Ranked: The Top 10 EV Battery Manufacturers
-

 Electrification2 years ago
The Key Minerals in an EV Battery
-

 Real Assets3 years ago
The World’s Top 10 Gold Mining Companies
-

 Misc3 years ago
All the Metals We Mined in One Visualization
-

 Electrification3 years ago
The Biggest Mining Companies in the World in 2021
-

 Energy Shift2 years ago
What Are the Five Major Types of Renewable Energy?
-

 Electrification2 years ago
Mapped: Solar Power by Country in 2021
-

 Electrification2 years ago
The World’s Largest Nickel Mining Companies