

Real Assets
Ranked: The U.S. Banks With the Most Uninsured Deposits
The U.S. Top Banks by Uninsured Deposits
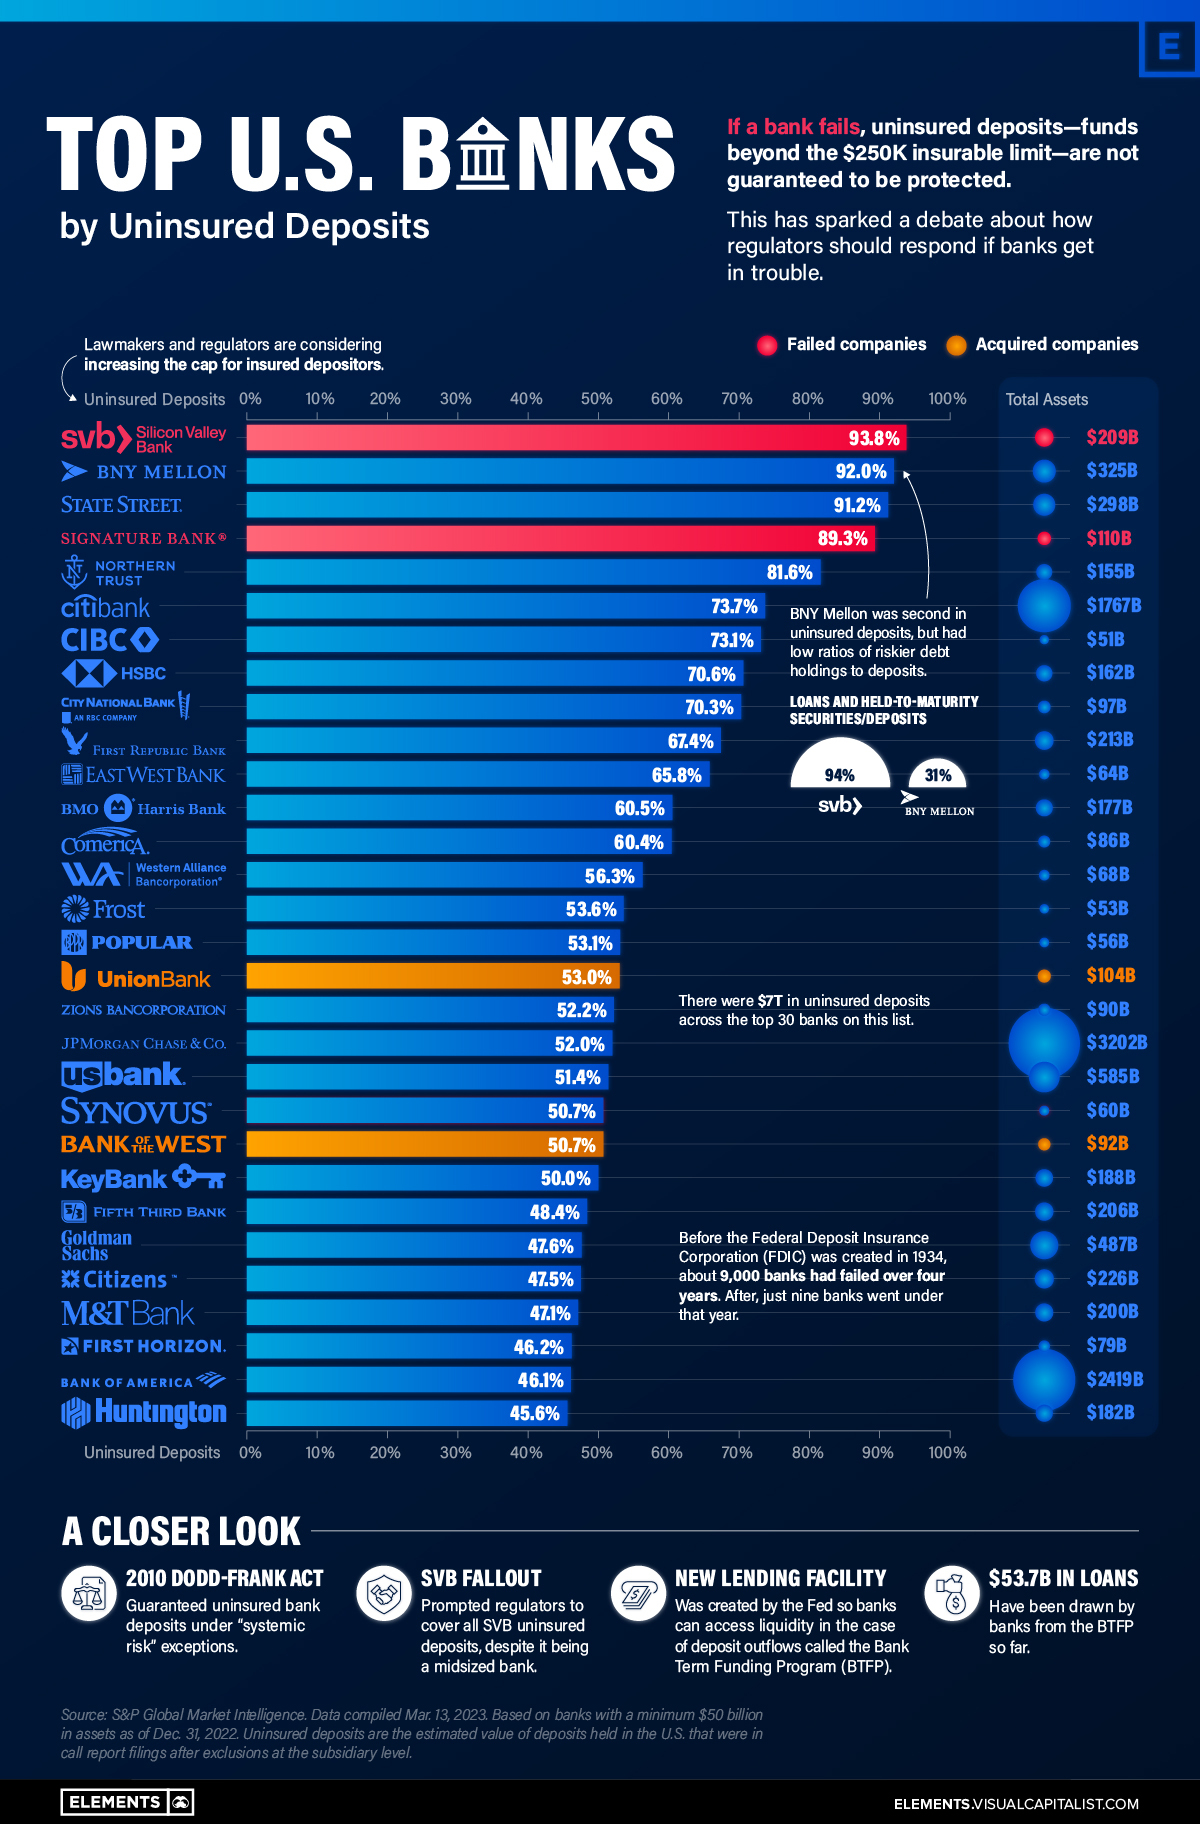
Today, there is at least $7 trillion in uninsured bank deposits in America.
This dollar value is roughly three times that of Apple’s market capitalization, or about equal to 30% of U.S. GDP. Uninsured deposits are ones that exceed the $250,000 limit insured by the Federal Deposit Insurance Corporation (FDIC), which was actually increased from $100,000 after the Global Financial Crisis. They account for roughly 40% of all bank deposits.
In the wake of the Silicon Valley Bank (SVB) fallout, we look at the 30 U.S. banks with the highest percentage of uninsured deposits, using data from S&P Global.
Which Banks Have the Most Uninsured Deposits?
Over the last month, SVB and Signature Bank went under at lightning speed.
Below, we show how their level of uninsured deposits compare to other banks. The dataset includes U.S. banks with at least $50 billion in assets at the end of 2022.
| Top 30 Rank | Bank | Uninsured Deposits (%) | Total Assets (B) |
|---|---|---|---|
| 1 | Silicon Valley Bank* | 93.8 | $209 |
| 2 | Bank of New York Mellon | 92.0 | $325 |
| 3 | State Street Bank and Trust Co. | 91.2 | $298 |
| 4 | Signature Bank* | 89.3 | $110 |
| 5 | Northern Trust Co. | 81.6 | $155 |
| 6 | Citibank NA | 73.7 | $1,767 |
| 7 | CIBC Bank USA | 73.1 | $51 |
| 8 | HSBC Bank USA NA | 70.6 | $162 |
| 9 | City National Bank | 70.3 | $97 |
| 10 | First Republic Bank | 67.4 | $213 |
| 11 | East West Bank | 65.8 | $64 |
| 12 | BMO Harris Bank NA | 60.5 | $177 |
| 13 | Comerica Bank | 60.4 | $86 |
| 14 | Western Alliance Bank | 56.3 | $68 |
| 15 | Frost Bank | 53.6 | $53 |
| 16 | Banco Popular de Puerto Rico | 53.1 | $56 |
| 17 | MUFG Union Bank NA** | 53.0 | $104 |
| 18 | Zions Bancorp. NA | 52.2 | $90 |
| 19 | JPMorgan Chase Bank NA | 52.0 | $3,202 |
| 20 | U.S. Bank NA | 51.4 | $585 |
| 21 | Synovus Bank | 50.7 | $60 |
| 22 | Bank of the West** | 50.7 | $92 |
| 23 | KeyBank NA | 50.0 | $188 |
| 24 | Fifth Third Bank NA | 48.4 | $206 |
| 25 | Goldman Sachs Bank USA | 47.6 | $487 |
| 26 | Citizens Bank NA | 47.5 | $226 |
| 27 | Manufacturers and Traders Trust Co. | 47.1 | $200 |
| 28 | First Horizon Bank | 46.2 | $79 |
| 29 | Bank of America NA | 46.1 | $2,419 |
| 30 | Huntington National Bank | 45.6 | $182 |
*Failed banks. **Acquired banks.
Bank of New York (BNY) Mellon and State Street Bank are the active banks with the highest levels of uninsured deposits. They are the two largest custodian banks in the U.S., followed by JP Morgan. Custodian banks provide critical infrastructure in the financial system, holding assets for safe-keeping for investment managers and transferring assets, among other duties.
Both BNY Mellon and State Street are considered “systemically important” banks.
Where these banks differ from SVB is that their loans and held-to-maturity securities as a percentage of total deposits are much lower. While these loans made up over 94% of SVB’s deposits, they made up 31% of BNY Mellon’s and 40% of State Street Bank’s deposits, respectively.
Held-to-maturity securities pose a greater risk to banks. Many of these holdings have lost value since interest rates have risen at a sharp clip. This presents interest-rate risks to banks. Consider how the value of long-term U.S. Treasurys declined about 30% in 2022. In this way, if a bank sells these assets before they mature, they take on a steep loss.
Overall, 11 banks on this list have loans and held-to-maturity assets that are over 90% of their total value of deposits.
Backstop Measures
To prevent wider ramifications, regulators implemented emergency actions. This was done by protecting all deposits of SVB and Signature Bank days after they announced failure.
The Fed also set up an emergency lending facility for banks. This Bank Term Funding Program (BTFP) was created to provide additional funding for banks if depositors pulled their money. It was also set up to prevent banks from interest-rate risk.
So far, more than $50 billion in loans have been withdrawn from the BTFP, up from $11.9 billion in its first week. (The Federal Reserve updates these numbers on a weekly basis.) This has led the Fed’s balance sheet to once again tick higher after slowly declining with the introduction of quantitative tightening in 2022.
Between a Rock and a Hard Place
What does this mean for the U.S. banking system, and what are the implications for depositors and the broader financial system?
On the one hand, the Fed may have had no other option than to save the banks.
“The way the world is, the government had no alternative but to back all deposits. Or we would have had the biggest goddamn bunch of bank runs you ever saw.”
-Charles Munger
The bigger problem is that it introduces new risk into the system. If market participants expect the Fed to always come to the rescue, they will likely make less prudent decisions. Beyond this, the ultra-low interest rate environment not only made banks more sensitive to interest-rate risk as rates went up, but it also lowered the cost of risk-taking.
Now, the Fed has said that they could take necessary actions to protect uninsured deposits. How quickly BTFP loans increase in the next few months will be anyone’s guess as clients from smaller banks withdraw funds and send to larger ones or invest in money market funds.
Editor’s note: Not all types of uninsured deposits are created equal. For custodian banks, retail deposits can make up a smaller portion of total deposits while operational deposits comprise a larger share. These types of deposits hold large amounts of funds for other banks for the purposes of custody or clearing and cash management, among other functions. For this reason, they are often considered more stable forms of deposits.


Real Assets
Charted: The Value Gap Between the Gold Price and Gold Miners
While gold prices hit all-time highs, gold mining stocks have lagged far behind.

Gold Price vs. Gold Mining Stocks
This was originally posted on our Voronoi app. Download the app for free on Apple or Android and discover incredible data-driven charts from a variety of trusted sources.
Although the price of gold has reached new record highs in 2024, gold miners are still far from their 2011 peaks.
In this graphic, we illustrate the evolution of gold prices since 2000 compared to the NYSE Arca Gold BUGS Index (HUI), which consists of the largest and most widely held public gold production companies. The data was compiled by Incrementum AG.
Mining Stocks Lag Far Behind
In April 2024, gold reached a new record high as Federal Reserve Chair Jerome Powell signaled policymakers may delay interest rate cuts until clearer signs of declining inflation materialize.
Additionally, with elections occurring in more than 60 countries in 2024 and ongoing conflicts in Ukraine and Gaza, central banks are continuing to buy gold to strengthen their reserves, creating momentum for the metal.
Traditionally known as a hedge against inflation and a safe haven during times of political and economic uncertainty, gold has climbed over 11% so far this year.
According to Business Insider, gold miners experienced their best performance in a year in March 2024. During that month, the gold mining sector outperformed all other U.S. industries, surpassing even the performance of semiconductor stocks.
Still, physical gold has outperformed shares of gold-mining companies over the past three years by one of the largest margins in decades.
| Year | Gold Price | NYSE Arca Gold BUGS Index (HUI) |
|---|---|---|
| 2023 | $2,062.92 | $243.31 |
| 2022 | $1,824.32 | $229.75 |
| 2021 | $1,828.60 | $258.87 |
| 2020 | $1,895.10 | $299.64 |
| 2019 | $1,523.00 | $241.94 |
| 2018 | $1,281.65 | $160.58 |
| 2017 | $1,296.50 | $192.31 |
| 2016 | $1,151.70 | $182.31 |
| 2015 | $1,060.20 | $111.18 |
| 2014 | $1,199.25 | $164.03 |
| 2013 | $1,201.50 | $197.70 |
| 2012 | $1,664.00 | $444.22 |
| 2011 | $1,574.50 | $498.73 |
| 2010 | $1,410.25 | $573.32 |
| 2009 | $1,104.00 | $429.91 |
| 2008 | $865.00 | $302.41 |
| 2007 | $836.50 | $409.37 |
| 2006 | $635.70 | $338.24 |
| 2005 | $513.00 | $276.90 |
| 2004 | $438.00 | $215.33 |
| 2003 | $417.25 | $242.93 |
| 2002 | $342.75 | $145.12 |
| 2001 | $276.50 | $65.20 |
| 2000 | $272.65 | $40.97 |
Among the largest companies on the NYSE Arca Gold BUGS Index, Colorado-based Newmont has experienced a 24% drop in its share price over the past year. Similarly, Canadian Barrick Gold also saw a decline of 6.5% over the past 12 months.
Real Assets
200 Years of Global Gold Production, by Country
Global gold production has grown exponentially since the 1800s, with 86% of all above-ground gold mined in the last 200 years.


Visualizing Global Gold Production Over 200 Years
Although the practice of gold mining has been around for thousands of years, it’s estimated that roughly 86% of all above-ground gold was extracted in the last 200 years.
With modern mining techniques making large-scale production possible, global gold production has grown exponentially since the 1800s.
The above infographic uses data from Our World in Data to visualize global gold production by country from 1820 to 2022, showing how gold mining has evolved to become increasingly global over time.
A Brief History of Gold Mining
The best-known gold rush in modern history occurred in California in 1848, when James Marshall discovered gold in Sacramento Valley. As word spread, thousands of migrants flocked to California in search of gold, and by 1855, miners had extracted around $2 billion worth of gold.
The United States, Australia, and Russia were (interchangeably) the three largest gold producers until the 1890s. Then, South Africa took the helm thanks to the massive discovery in the Witwatersrand Basin, now regarded today as one of the world’s greatest ever goldfields.
South Africa’s annual gold production peaked in 1970 at 1,002 tonnes—by far the largest amount of gold produced by any country in a year.
With the price of gold rising since the 1980s, global gold production has become increasingly widespread. By 2007, China was the world’s largest gold-producing nation, and today a significant quantity of gold is being mined in over 40 countries.
The Top Gold-Producing Countries in 2022
Around 31% of the world’s gold production in 2022 came from three countries—China, Russia, and Australia, with each producing over 300 tonnes of the precious metal.
| Rank | Country | 2022E Gold Production, tonnes | % of Total |
|---|---|---|---|
| #1 | 🇨🇳 China | 330 | 11% |
| #2 | 🇷🇺 Russia | 320 | 10% |
| #3 | 🇦🇺 Australia | 320 | 10% |
| #4 | 🇨🇦 Canada | 220 | 7% |
| #5 | 🇺🇸 United States | 170 | 5% |
| #6 | 🇲🇽 Mexico | 120 | 4% |
| #7 | 🇰🇿 Kazakhstan | 120 | 4% |
| #8 | 🇿🇦 South Africa | 110 | 4% |
| #9 | 🇵🇪 Peru | 100 | 3% |
| #10 | 🇺🇿 Uzbekistan | 100 | 3% |
| #11 | 🇬🇭 Ghana | 90 | 3% |
| #12 | 🇮🇩 Indonesia | 70 | 2% |
| - | 🌍 Rest of the World | 1,030 | 33% |
| - | World Total | 3,100 | 100% |
North American countries Canada, the U.S., and Mexico round out the top six gold producers, collectively making up 16% of the global total. The state of Nevada alone accounted for 72% of U.S. production, hosting the world’s largest gold mining complex (including six mines) owned by Nevada Gold Mines.
Meanwhile, South Africa produced 110 tonnes of gold in 2022, down by 74% relative to its output of 430 tonnes in 2000. This long-term decline is the result of mine closures, maturing assets, and industrial conflict, according to the World Gold Council.
Interestingly, two smaller gold producers on the list, Uzbekistan and Indonesia, host the second and third-largest gold mining operations in the world, respectively.
The Outlook for Global Gold Production
As of April 25, gold prices were hovering around the $2,000 per ounce mark and nearing all-time highs. For mining companies, higher gold prices can mean more profits per ounce if costs remain unaffected.
According to the World Gold Council, mined gold production is expected to increase in 2023 and could surpass the record set in 2018 (3,300 tonnes), led by the expansion of existing projects in North America. The chances of record mine output could be higher if gold prices continue to increase.

-

 Electrification3 years ago
Ranked: The Top 10 EV Battery Manufacturers
-

 Electrification2 years ago
The Key Minerals in an EV Battery
-

 Real Assets3 years ago
The World’s Top 10 Gold Mining Companies
-

 Misc3 years ago
All the Metals We Mined in One Visualization
-

 Electrification3 years ago
The Biggest Mining Companies in the World in 2021
-

 Energy Shift2 years ago
What Are the Five Major Types of Renewable Energy?
-

 Electrification2 years ago
Mapped: Solar Power by Country in 2021
-

 Electrification2 years ago
The World’s Largest Nickel Mining Companies