

Real Assets
Visualizing Currencies’ Decline Against the U.S. Dollar
Visualizing Currencies’ Decline Against the U.S. Dollar
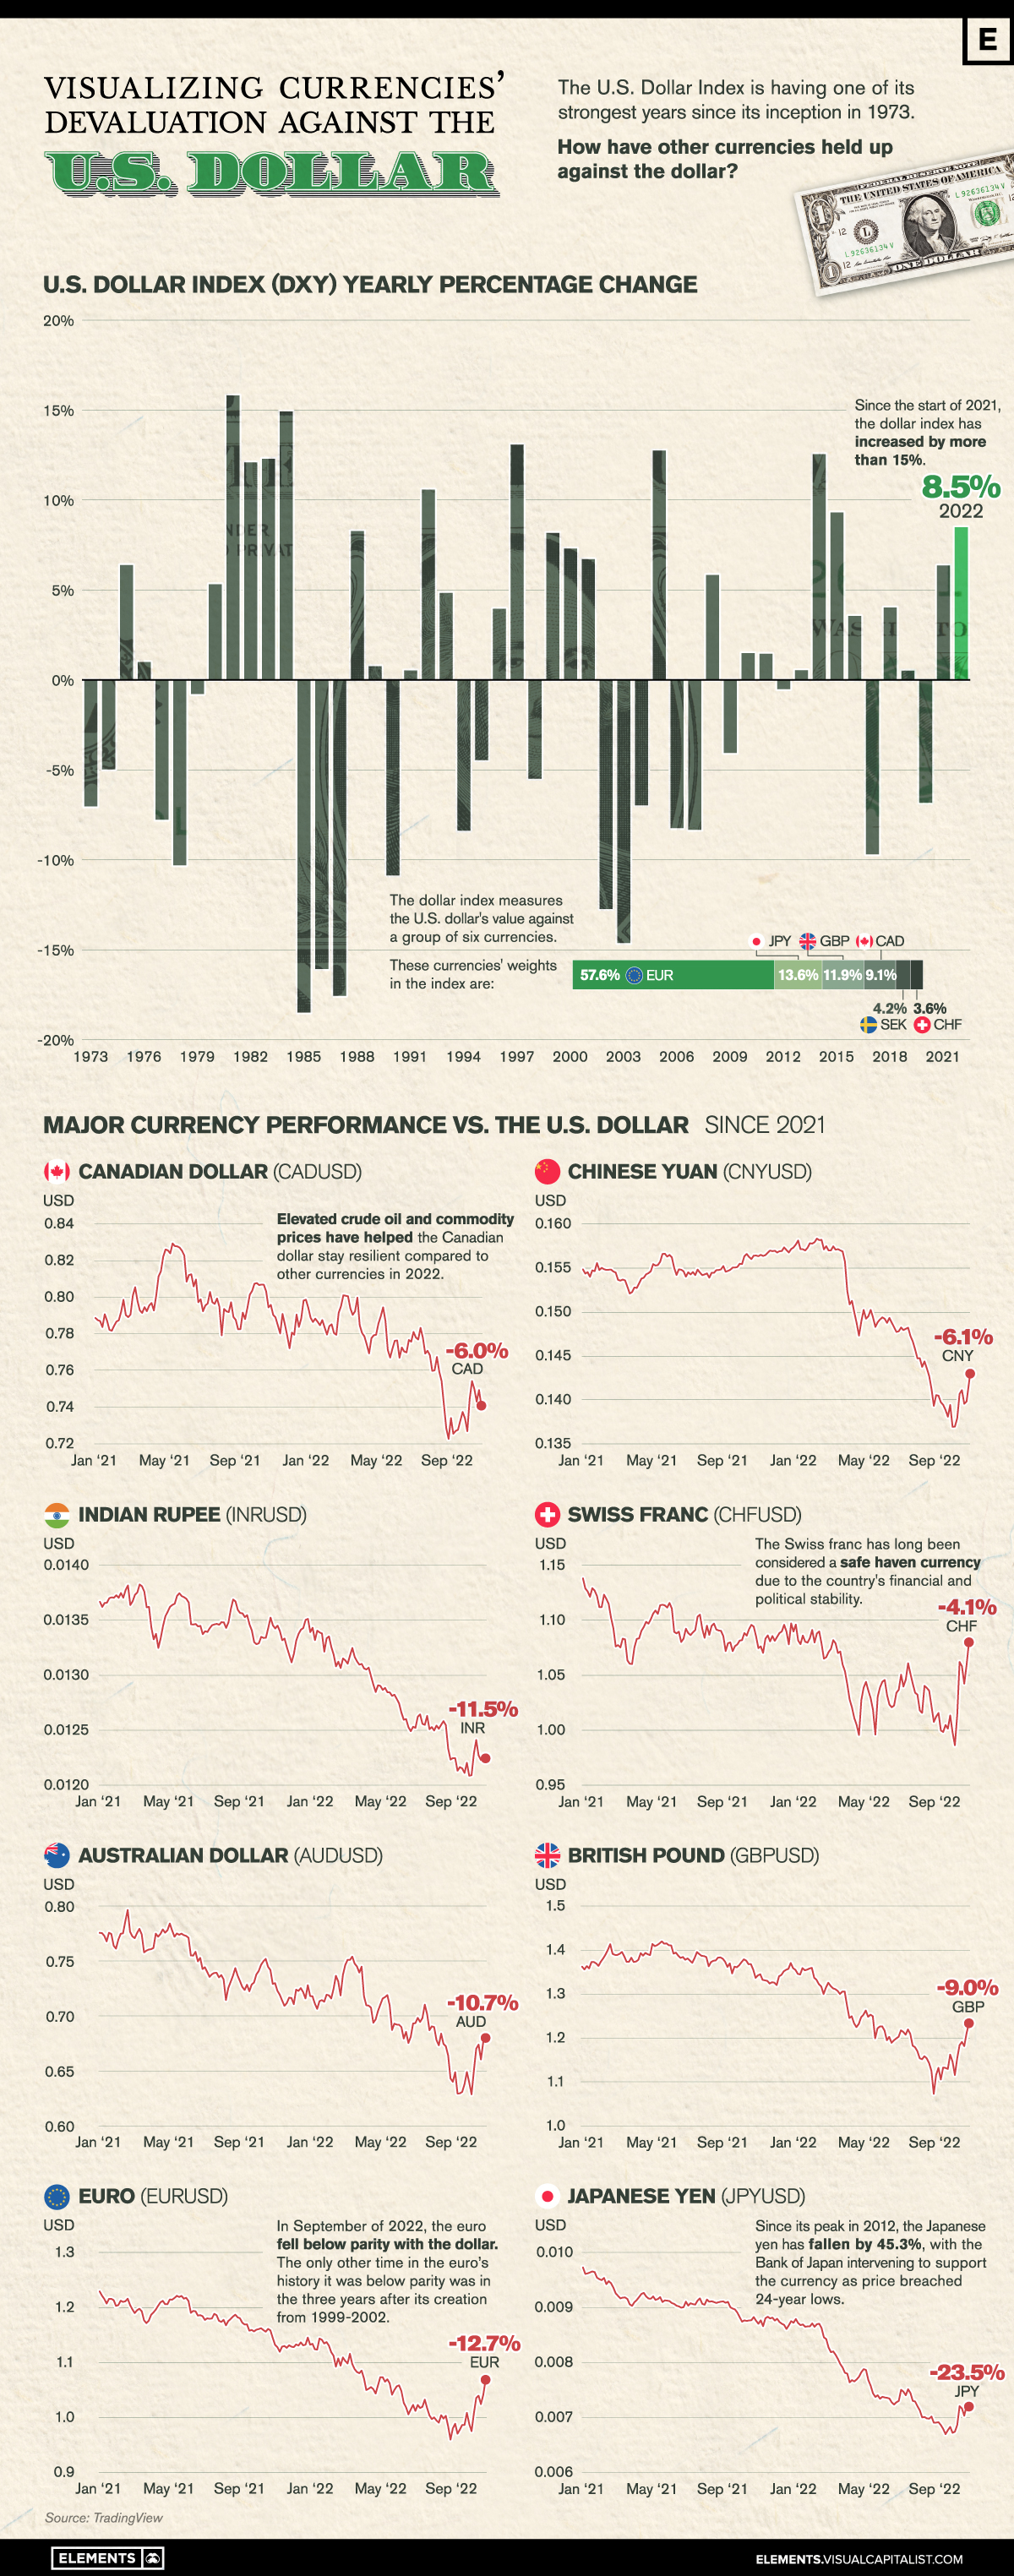
In a highly volatile and difficult year for many currencies and equities, the U.S. dollar has been a safe haven for investors.
The greenback has provided exceptional stability, with almost every currency around the world declining against the U.S. dollar in 2022.
This graphic visualizes almost 50 years of the Dollar Index’s returns along with the decline of major currencies against the U.S. dollar in the past two years using price data from TradingView.
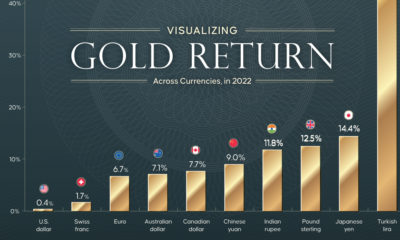
U.S. Dollar and Major Currencies’ Returns in 2022
As shown in the graphic above, the past two years have seen nearly every major currency lose value against the U.S. dollar.
One of the currencies hit hardest is the euro, which briefly fell below parity (meaning the euro was worth less than one U.S. dollar) in September and October of 2022, before recovering with a 5.3% rally in November.
| Currency | 2021 Returns | 2022 YTD Returns |
|---|---|---|
| Japanese Yen (JPYUSD) 🇯🇵 | -10.4% | -14.7% |
| Indian Rupee (INRUSD) 🇮🇳 | 2.0% | -9.6% |
| Pound Sterling (GBPUSD) 🇬🇧 | -1.1% | -8.0% |
| Chinese Yuan (CNYUSD) 🇨🇳 | 2.7% | -8.6% |
| Euro (EURUSD) 🇪🇺 | -7.0% | -6.0% |
| Canadian Dollar (CADUSD) 🇨🇦 | 0.7% | -6.6% |
| Australian Dollar (AUDUSD) 🇦🇺 | -5.7% | -5.2% |
| Swiss Franc (CHFUSD) 🇨🇭 | -3.0% | -1.1% |
2022 YTD Returns as of December 14th 2022. (Source: TradingView)
However, the Japanese yen was the major currency hit hardest, having fallen more than 25% since the start of 2021. At the yen’s lowest point this year in October, the currency breached 24-year lows, resulting in the Bank of Japan intervening with $42.8 billion to support the country’s falling currency.
The Swiss franc and Canadian dollar have been the most resilient major currencies against the U.S. dollar since 2021, largely due to the financial and political stability of those nations. Along with this, Canada has benefitted from surging crude oil prices in 2022, exporting the majority of its crude oil across its southern border to America.
Three Reasons for the U.S. Dollar’s Strength in 2022
A variety of factors have contributed to the U.S. dollar’s strength in 2022. The rapid raising of interest rates by the Federal Reserve and tightening of their balance sheet has resulted in U.S. dollars becoming a more scarce and valuable yield-bearing asset.
As interest rates have risen, so have yields for savings accounts and fixed-income securities like U.S. treasuries, making them a more attractive alternative for investors.
At the same time, falling equity prices (especially in the technology sector) only further incentivized investors to pull out of riskier equity markets into the safety of the dollar.
Lastly, compared to many other global economies, the U.S. economy has remained resilient with the fewest risks on its horizon. Europe continues to face an ongoing energy crunch with the Russia-Ukraine conflict nearby, while China’s zero-COVID policies have hampered the country’s manufacturing sector, as well as other industries.
How Will Currencies Fare in 2023?
While the U.S. dollar has surged for much of 2022, its rally has started losing steam in the final months of the year.
In September of 2022 the Dollar Index was up 20% on the year reaching a high of 114.8, but has since retreated and given back more than half its gains for this year so far.
Investors around the world will be watching closely to see if the U.S. dollar’s rise will continue, or if this end-of-year reversal will carry through and provide major currencies some relief going into 2023.


Real Assets
Charted: The Value Gap Between the Gold Price and Gold Miners
While gold prices hit all-time highs, gold mining stocks have lagged far behind.

Gold Price vs. Gold Mining Stocks
This was originally posted on our Voronoi app. Download the app for free on Apple or Android and discover incredible data-driven charts from a variety of trusted sources.
Although the price of gold has reached new record highs in 2024, gold miners are still far from their 2011 peaks.
In this graphic, we illustrate the evolution of gold prices since 2000 compared to the NYSE Arca Gold BUGS Index (HUI), which consists of the largest and most widely held public gold production companies. The data was compiled by Incrementum AG.
Mining Stocks Lag Far Behind
In April 2024, gold reached a new record high as Federal Reserve Chair Jerome Powell signaled policymakers may delay interest rate cuts until clearer signs of declining inflation materialize.
Additionally, with elections occurring in more than 60 countries in 2024 and ongoing conflicts in Ukraine and Gaza, central banks are continuing to buy gold to strengthen their reserves, creating momentum for the metal.
Traditionally known as a hedge against inflation and a safe haven during times of political and economic uncertainty, gold has climbed over 11% so far this year.
According to Business Insider, gold miners experienced their best performance in a year in March 2024. During that month, the gold mining sector outperformed all other U.S. industries, surpassing even the performance of semiconductor stocks.
Still, physical gold has outperformed shares of gold-mining companies over the past three years by one of the largest margins in decades.
| Year | Gold Price | NYSE Arca Gold BUGS Index (HUI) |
|---|---|---|
| 2023 | $2,062.92 | $243.31 |
| 2022 | $1,824.32 | $229.75 |
| 2021 | $1,828.60 | $258.87 |
| 2020 | $1,895.10 | $299.64 |
| 2019 | $1,523.00 | $241.94 |
| 2018 | $1,281.65 | $160.58 |
| 2017 | $1,296.50 | $192.31 |
| 2016 | $1,151.70 | $182.31 |
| 2015 | $1,060.20 | $111.18 |
| 2014 | $1,199.25 | $164.03 |
| 2013 | $1,201.50 | $197.70 |
| 2012 | $1,664.00 | $444.22 |
| 2011 | $1,574.50 | $498.73 |
| 2010 | $1,410.25 | $573.32 |
| 2009 | $1,104.00 | $429.91 |
| 2008 | $865.00 | $302.41 |
| 2007 | $836.50 | $409.37 |
| 2006 | $635.70 | $338.24 |
| 2005 | $513.00 | $276.90 |
| 2004 | $438.00 | $215.33 |
| 2003 | $417.25 | $242.93 |
| 2002 | $342.75 | $145.12 |
| 2001 | $276.50 | $65.20 |
| 2000 | $272.65 | $40.97 |
Among the largest companies on the NYSE Arca Gold BUGS Index, Colorado-based Newmont has experienced a 24% drop in its share price over the past year. Similarly, Canadian Barrick Gold also saw a decline of 6.5% over the past 12 months.
Real Assets
200 Years of Global Gold Production, by Country
Global gold production has grown exponentially since the 1800s, with 86% of all above-ground gold mined in the last 200 years.


Visualizing Global Gold Production Over 200 Years
Although the practice of gold mining has been around for thousands of years, it’s estimated that roughly 86% of all above-ground gold was extracted in the last 200 years.
With modern mining techniques making large-scale production possible, global gold production has grown exponentially since the 1800s.
The above infographic uses data from Our World in Data to visualize global gold production by country from 1820 to 2022, showing how gold mining has evolved to become increasingly global over time.
A Brief History of Gold Mining
The best-known gold rush in modern history occurred in California in 1848, when James Marshall discovered gold in Sacramento Valley. As word spread, thousands of migrants flocked to California in search of gold, and by 1855, miners had extracted around $2 billion worth of gold.
The United States, Australia, and Russia were (interchangeably) the three largest gold producers until the 1890s. Then, South Africa took the helm thanks to the massive discovery in the Witwatersrand Basin, now regarded today as one of the world’s greatest ever goldfields.
South Africa’s annual gold production peaked in 1970 at 1,002 tonnes—by far the largest amount of gold produced by any country in a year.
With the price of gold rising since the 1980s, global gold production has become increasingly widespread. By 2007, China was the world’s largest gold-producing nation, and today a significant quantity of gold is being mined in over 40 countries.
The Top Gold-Producing Countries in 2022
Around 31% of the world’s gold production in 2022 came from three countries—China, Russia, and Australia, with each producing over 300 tonnes of the precious metal.
| Rank | Country | 2022E Gold Production, tonnes | % of Total |
|---|---|---|---|
| #1 | 🇨🇳 China | 330 | 11% |
| #2 | 🇷🇺 Russia | 320 | 10% |
| #3 | 🇦🇺 Australia | 320 | 10% |
| #4 | 🇨🇦 Canada | 220 | 7% |
| #5 | 🇺🇸 United States | 170 | 5% |
| #6 | 🇲🇽 Mexico | 120 | 4% |
| #7 | 🇰🇿 Kazakhstan | 120 | 4% |
| #8 | 🇿🇦 South Africa | 110 | 4% |
| #9 | 🇵🇪 Peru | 100 | 3% |
| #10 | 🇺🇿 Uzbekistan | 100 | 3% |
| #11 | 🇬🇭 Ghana | 90 | 3% |
| #12 | 🇮🇩 Indonesia | 70 | 2% |
| - | 🌍 Rest of the World | 1,030 | 33% |
| - | World Total | 3,100 | 100% |
North American countries Canada, the U.S., and Mexico round out the top six gold producers, collectively making up 16% of the global total. The state of Nevada alone accounted for 72% of U.S. production, hosting the world’s largest gold mining complex (including six mines) owned by Nevada Gold Mines.
Meanwhile, South Africa produced 110 tonnes of gold in 2022, down by 74% relative to its output of 430 tonnes in 2000. This long-term decline is the result of mine closures, maturing assets, and industrial conflict, according to the World Gold Council.
Interestingly, two smaller gold producers on the list, Uzbekistan and Indonesia, host the second and third-largest gold mining operations in the world, respectively.
The Outlook for Global Gold Production
As of April 25, gold prices were hovering around the $2,000 per ounce mark and nearing all-time highs. For mining companies, higher gold prices can mean more profits per ounce if costs remain unaffected.
According to the World Gold Council, mined gold production is expected to increase in 2023 and could surpass the record set in 2018 (3,300 tonnes), led by the expansion of existing projects in North America. The chances of record mine output could be higher if gold prices continue to increase.

-

 Electrification3 years ago
Ranked: The Top 10 EV Battery Manufacturers
-

 Electrification2 years ago
The Key Minerals in an EV Battery
-

 Real Assets3 years ago
The World’s Top 10 Gold Mining Companies
-

 Misc3 years ago
All the Metals We Mined in One Visualization
-

 Electrification3 years ago
The Biggest Mining Companies in the World in 2021
-

 Energy Shift2 years ago
What Are the Five Major Types of Renewable Energy?
-

 Electrification2 years ago
Mapped: Solar Power by Country in 2021
-

 Electrification2 years ago
The World’s Largest Nickel Mining Companies