

Real Assets
Visualizing the $2.9B Money Flow into Gold Exploration
Visualizing the $2.9B Money Flow into Gold Exploration
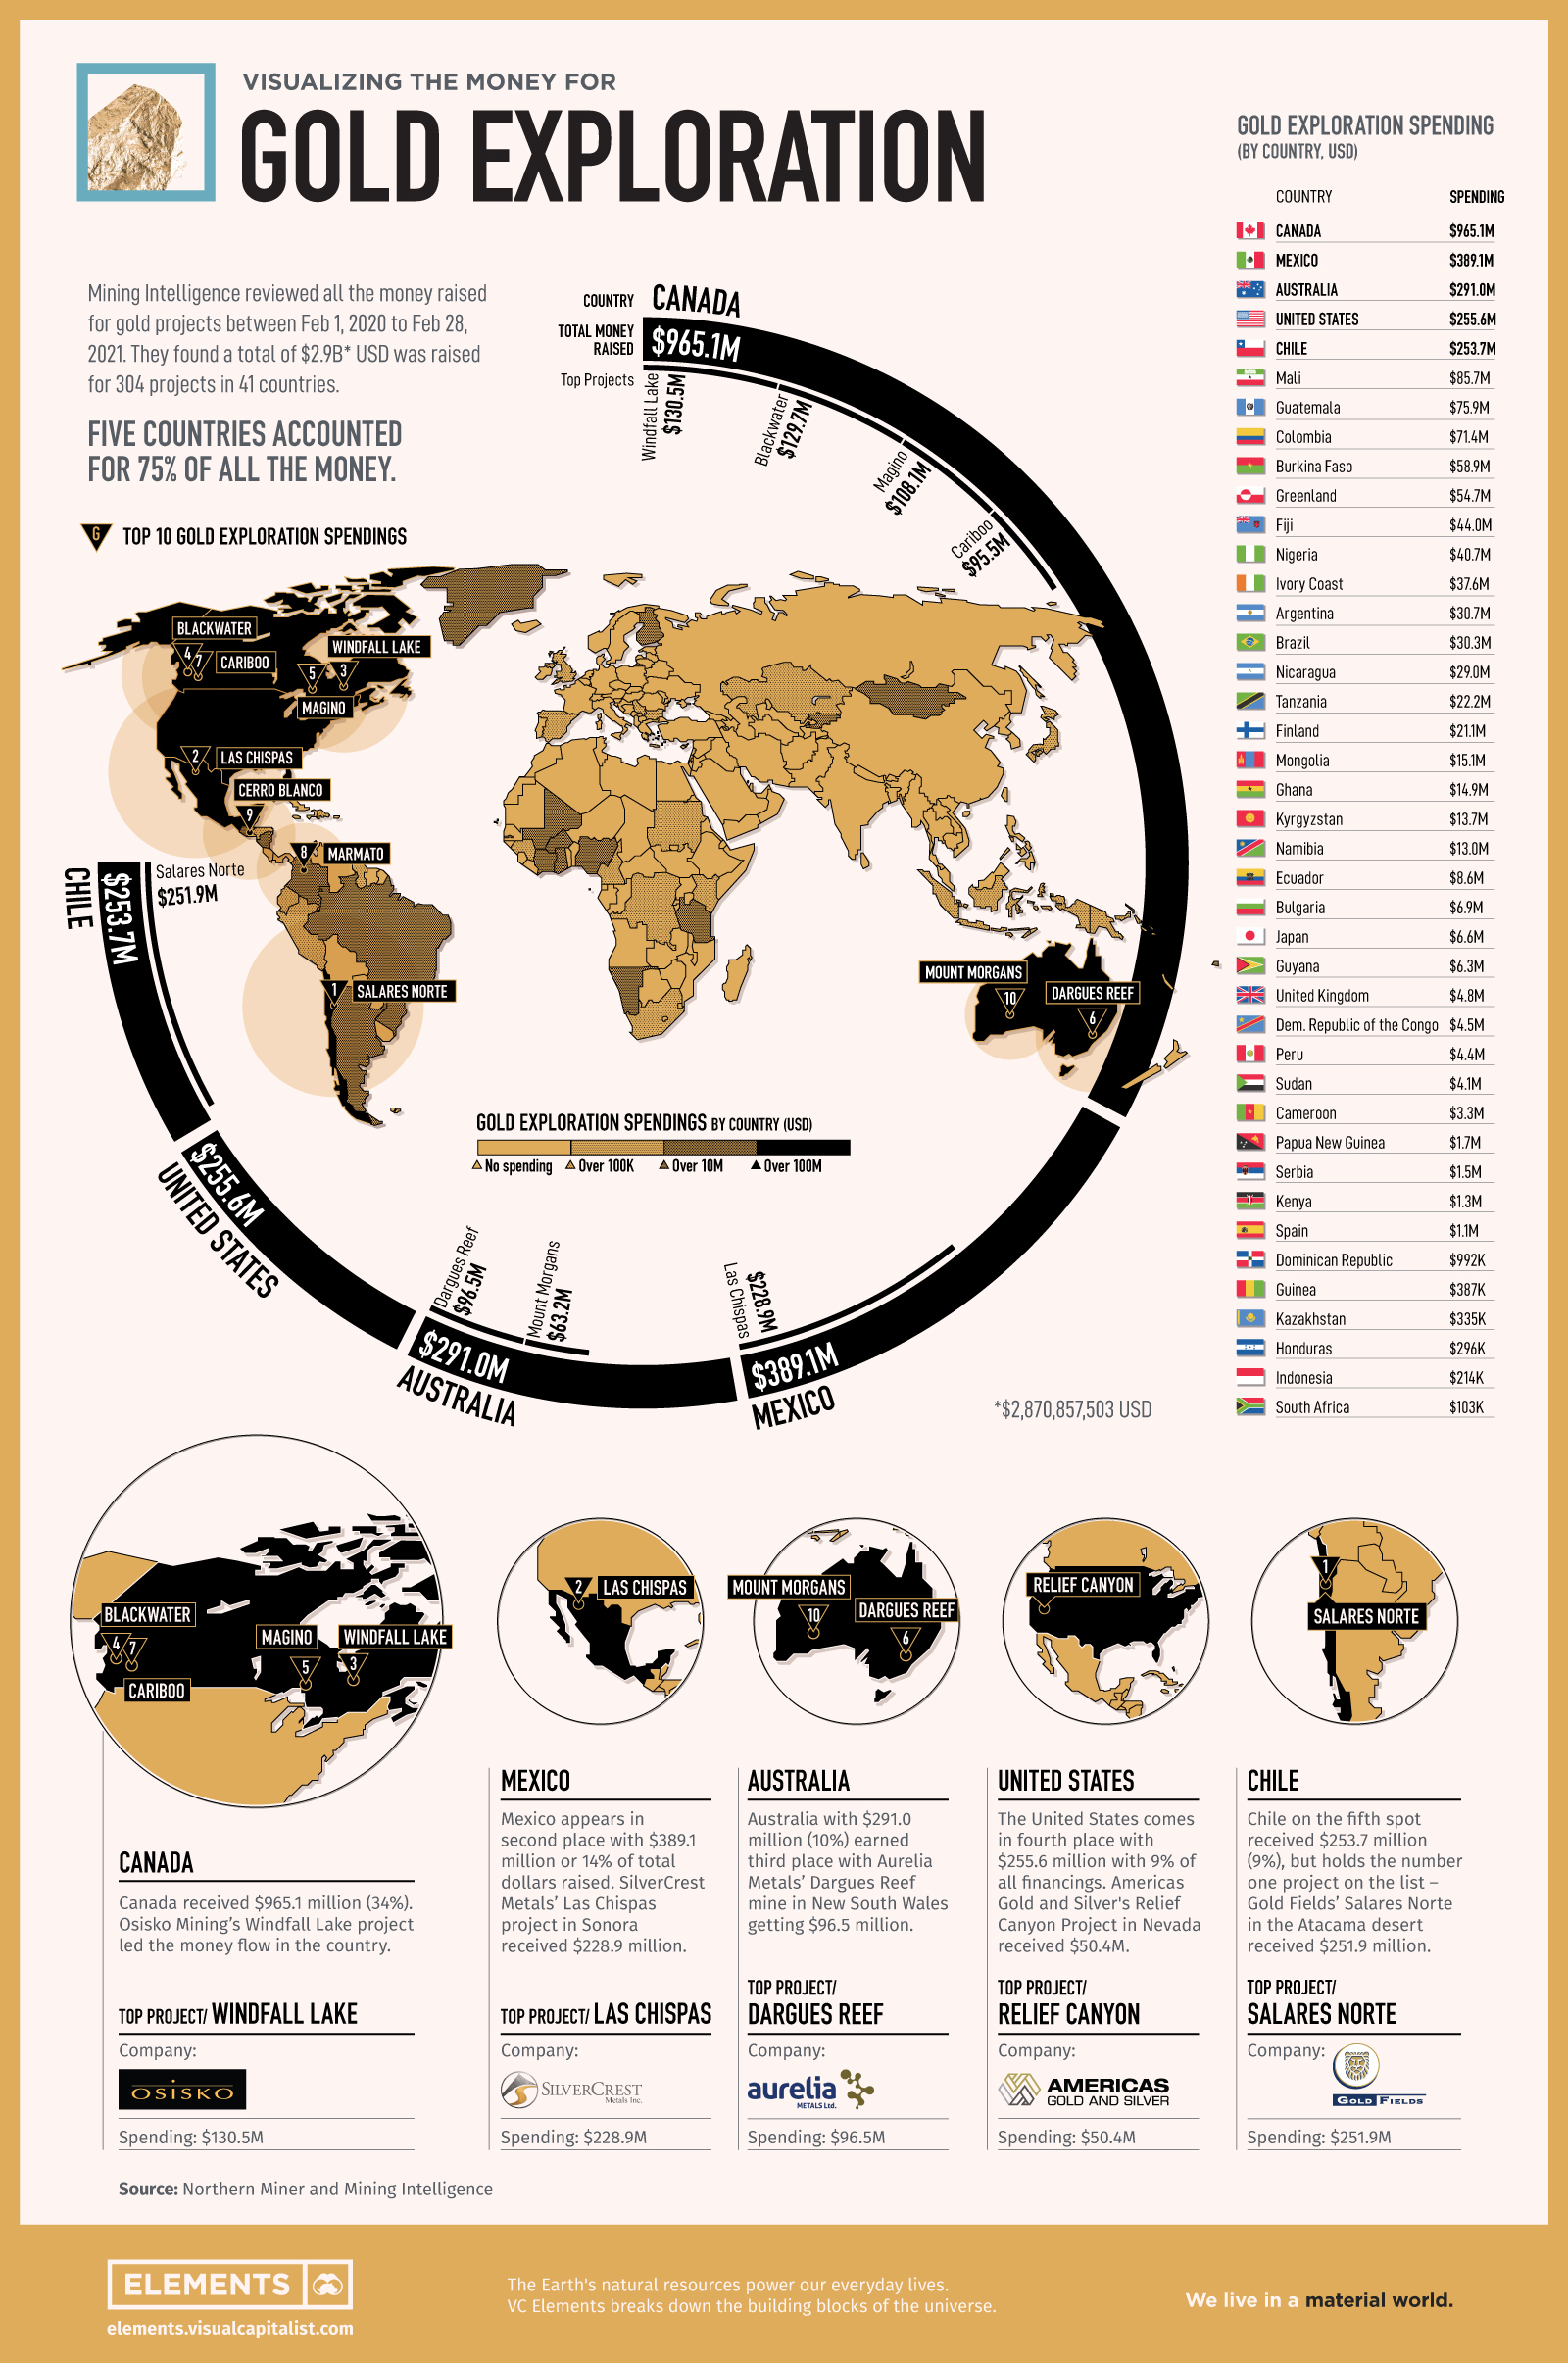
In 2020, the price of gold reached multi-year highs, in part to the impact of COVID-19 shutdowns. This renewed interest in gold spurred the plans of many gold exploration and development projects around the world.
This infographic uses data from Mining Intelligence which tracked the $2.87 billion from 425 transactions for gold projects in 41 countries between February 1, 2020, and February 28, 2021.
Gold Financings, by Country
Five countries accounted for 75% of the money raised for top gold projects around the world.
Canada attracted the most with $965 million or roughly 34% of all the money raised for gold exploration and development.
| Country | Amounts ($USD) | Number of Transactions |
|---|---|---|
| Canada | $965,066,856 | 180 |
| Mexico | $389,087,534 | 25 |
| Australia | $291,040,977 | 43 |
| United States | $255,563,607 | 82 |
| Chile | $253,711,427 | 2 |
| Mali | $85,728,402 | 13 |
| Guatemala | $75,939,982 | 4 |
| Colombia | $71,389,229 | 4 |
| Burkina Faso | $58,937,852 | 2 |
| Greenland | $54,739,544 | 1 |
| Fiji | $44,024,224 | 3 |
| Nigeria | $40,660,735 | 1 |
| Ivory Coast | $37,608,031 | 4 |
| Argentina | $30,678,621 | 5 |
| Brazil | $30,292,143 | 9 |
| Nicaragua | $29,040,361 | 4 |
| Tanzania | $22,215,178 | 2 |
| Finland | $2,106,0740 | 2 |
| Mongolia | $15,120,700 | 1 |
| Ghana | $14,894,336 | 4 |
| Kyrgyzstan | $13,651,801 | 1 |
| Namibia | $13,041,621 | 1 |
| Ecuador | $8,644,975 | 1 |
| Bulgaria | $6,879,450 | 1 |
| Japan | $6,569,742 | 2 |
| Guyana | $6,282,134 | 2 |
| United Kingdom | $4,796,983 | 3 |
| Dem. Republic of the Congo | $4,528,450 | 1 |
| Peru | $4,436,335 | 6 |
| Sudan | $4,066,484 | 1 |
| Cameroon | $3,252,956 | 4 |
| Papua New Guinea | $1,737,903 | 2 |
| Serbia | $1,478,579 | 1 |
| Kenya | $1,288,041 | 1 |
| Spain | $1,074,211 | 1 |
| Dominican Republic | $992,252 | 1 |
| Guinea | $387,483 | 1 |
| Kazakhstan | $334,733 | 1 |
| Honduras | $296,096 | 1 |
| Indonesia | $213,835 | 1 |
| South Africa | $102,959 | 1 |
| Total | $2,870,857,503 | 425 |
In second place, Mexico attracted $389 million or 14% of total exploration dollars raised while Australia with $291 million (10%) is in third place.
The United States comes in fourth place with $256 million or 9% of global gold exploration dollars. Chile on the fifth spot received $254 million (9%) with one project attracting the largest amount of any on the list.
Top 10 Financings by Gold Project
Focusing on individual projects, Gold Fields’ Salares Norte project in Chile received $252 million for the largest financing of the period. The company started construction this year, after a delicate operation to remove endangered chinchillas from the site.
Silvercrest’s Las Chispas project in Mexico’s Sonora state received $228.9 million, giving it the second largest sum. According to the company, the property hosts 94.7 million ounces of silver equivalent (AgEq) in proven and provable reserves.
| Properties | Location | Amount ($USD) | Company |
|---|---|---|---|
| Salares Norte | 🇨🇱 Chile | $251,845,426 | Gold Fields Ltd. |
| Las Chispas | 🇲🇽 Mexico | $228,858,469 | SilverCrest Metals Inc. |
| Windfall Lake | 🇨🇦 Canada | $130,539,783 | Osisko Mining Inc. |
| Blackwater | 🇨🇦 Canada | $129,712,140 | Artemis Gold Inc. |
| Magino | 🇨🇦 Canada | $108,128,440 | Argonaut Gold Inc. |
| Dargues Reef | 🇦🇺 Australia | $96,500,680 | Aurelia Metals Ltd |
| Cariboo | 🇨🇦 Canada | $95,460,630 | Osisko Development Corp. |
| Marmato | 🇨🇴 Colombia | $66,116,989 | Aris Gold Corp. |
| Cerro Blanco | 🇬🇹 Guatemala | $65,632,958 | Bluestone Resources Inc. |
| Mount Morgans | 🇦🇺 Australia | $63,179,600 | Dacian Gold Ltd. |
Gold is Canada’s most valuable mined mineral and the next 3 projects on the list show this priority. Osisko Mining’s Windfall Lake project in Quebec is third ($130 million), Artemis Gold’s Blackwater mine ($130 million) in British Columbia is the fourth, and Argonaut’s Magino project in Ontario ($108 million) the fifth.
The analysis found that more than half of the money raised (57%), went to 63 gold projects to advance economic studies – from scoping studies or preliminary economic assessments through to bankable feasibility studies and permitting.
A total of 71% of the projects were in the early stages of exploration, but they only accounted for about 25% of the total capital raised during the period.
Gold Going Forward
With $2.9 billion in capital going into gold projects around the world, the gold industry has big plans. These financings represent opportunities for host countries’ economies and their workers, along with more gold for investors to buy.


Real Assets
Visualizing Global Gold Production in 2023
Gold production in 2023 was led by China, Australia, and Russia, with each outputting over 300 tonnes.
Visualizing Global Gold Production in 2023
This was originally posted on our Voronoi app. Download the app for free on iOS or Android and discover incredible data-driven charts from a variety of trusted sources.
Over 3,000 tonnes of gold were produced globally in 2023.
In this graphic, we list the world’s leading countries in terms of gold production. These figures come from the latest USGS publication on gold statistics (published January 2024).
China, Australia, and Russia Produced the Most Gold in 2023
China was the top producer in 2023, responsible for over 12% of total global production, followed by Australia and Russia.
| Country | Region | 2023E Production (tonnes) |
|---|---|---|
| 🇨🇳 China | Asia | 370 |
| 🇦🇺 Australia | Oceania | 310 |
| 🇷🇺 Russia | Europe | 310 |
| 🇨🇦 Canada | North America | 200 |
| 🇺🇸 United States | North America | 170 |
| 🇰🇿 Kazakhstan | Asia | 130 |
| 🇲🇽 Mexico | North America | 120 |
| 🇮🇩 Indonesia | Asia | 110 |
| 🇿🇦 South Africa | Africa | 100 |
| 🇺🇿 Uzbekistan | Asia | 100 |
| 🇬🇭 Ghana | Africa | 90 |
| 🇵🇪 Peru | South America | 90 |
| 🇧🇷 Brazil | South America | 60 |
| 🇧🇫 Burkina Faso | Africa | 60 |
| 🇲🇱 Mali | Africa | 60 |
| 🇹🇿 Tanzania | Africa | 60 |
| 🌍 Rest of World | - | 700 |
Gold mines in China are primarily concentrated in eastern provinces such as Shandong, Henan, Fujian, and Liaoning. As of January 2024, China’s gold mine reserves stand at an estimated 3,000 tonnes, representing around 5% of the global total of 59,000 tonnes.
In addition to being the top producer, China emerged as the largest buyer of the yellow metal for the year. In fact, the country’s central bank alone bought 225 tonnes of gold in 2023, according the World Gold Council.
Estimated Global Gold Consumption
Most of the gold produced in 2023 was used in jewelry production, while another significant portion was sold as a store of value, such as in gold bars or coins.
- Jewelry: 46%
- Central Banks and Institutions: 23%
- Physical Bars: 16%
- Official Coins, Medals, and Imitation Coins: 9%
- Electrical and Electronics: 5%
- Other: 1%
According to Fitch Solutions, over the medium term (2023-2032), global gold mine production is expected to grow 15%, as high prices encourage investment and output.
Real Assets
Charted: The Value Gap Between the Gold Price and Gold Miners
While gold prices hit all-time highs, gold mining stocks have lagged far behind.

Gold Price vs. Gold Mining Stocks
This was originally posted on our Voronoi app. Download the app for free on Apple or Android and discover incredible data-driven charts from a variety of trusted sources.
Although the price of gold has reached new record highs in 2024, gold miners are still far from their 2011 peaks.
In this graphic, we illustrate the evolution of gold prices since 2000 compared to the NYSE Arca Gold BUGS Index (HUI), which consists of the largest and most widely held public gold production companies. The data was compiled by Incrementum AG.
Mining Stocks Lag Far Behind
In April 2024, gold reached a new record high as Federal Reserve Chair Jerome Powell signaled policymakers may delay interest rate cuts until clearer signs of declining inflation materialize.
Additionally, with elections occurring in more than 60 countries in 2024 and ongoing conflicts in Ukraine and Gaza, central banks are continuing to buy gold to strengthen their reserves, creating momentum for the metal.
Traditionally known as a hedge against inflation and a safe haven during times of political and economic uncertainty, gold has climbed over 11% so far this year.
According to Business Insider, gold miners experienced their best performance in a year in March 2024. During that month, the gold mining sector outperformed all other U.S. industries, surpassing even the performance of semiconductor stocks.
Still, physical gold has outperformed shares of gold-mining companies over the past three years by one of the largest margins in decades.
| Year | Gold Price | NYSE Arca Gold BUGS Index (HUI) |
|---|---|---|
| 2023 | $2,062.92 | $243.31 |
| 2022 | $1,824.32 | $229.75 |
| 2021 | $1,828.60 | $258.87 |
| 2020 | $1,895.10 | $299.64 |
| 2019 | $1,523.00 | $241.94 |
| 2018 | $1,281.65 | $160.58 |
| 2017 | $1,296.50 | $192.31 |
| 2016 | $1,151.70 | $182.31 |
| 2015 | $1,060.20 | $111.18 |
| 2014 | $1,199.25 | $164.03 |
| 2013 | $1,201.50 | $197.70 |
| 2012 | $1,664.00 | $444.22 |
| 2011 | $1,574.50 | $498.73 |
| 2010 | $1,410.25 | $573.32 |
| 2009 | $1,104.00 | $429.91 |
| 2008 | $865.00 | $302.41 |
| 2007 | $836.50 | $409.37 |
| 2006 | $635.70 | $338.24 |
| 2005 | $513.00 | $276.90 |
| 2004 | $438.00 | $215.33 |
| 2003 | $417.25 | $242.93 |
| 2002 | $342.75 | $145.12 |
| 2001 | $276.50 | $65.20 |
| 2000 | $272.65 | $40.97 |
Among the largest companies on the NYSE Arca Gold BUGS Index, Colorado-based Newmont has experienced a 24% drop in its share price over the past year. Similarly, Canadian Barrick Gold also saw a decline of 6.5% over the past 12 months.

-

 Electrification3 years ago
Ranked: The Top 10 EV Battery Manufacturers
-

 Electrification2 years ago
The Key Minerals in an EV Battery
-

 Real Assets3 years ago
The World’s Top 10 Gold Mining Companies
-

 Misc3 years ago
All the Metals We Mined in One Visualization
-

 Energy Shift2 years ago
What Are the Five Major Types of Renewable Energy?
-

 Electrification2 years ago
Mapped: Solar Power by Country in 2021
-

 Electrification2 years ago
The World’s Largest Nickel Mining Companies
-

 Misc3 years ago
The Largest Copper Mines in the World by Capacity