

Real Assets
Visualizing Two Decades of Central Bank Gold Reserve Changes
Gold-Hoarding Nations: Changing Gold Reserves Since 2000
Gold has long been an important hedge in times of uncertainty, and unlike foreign currencies, equities, or debt securities, its value is not dependent on any company or nation’s solvency.
This has made gold an essential part of many national central bank reserves, especially as the monetary supply of many nations continues to expand and central banks are exploring digital currencies which could be reserve or gold backed.
With gold still making up a large part of many nations’ reserves, how have central banks been managing the precious metal?
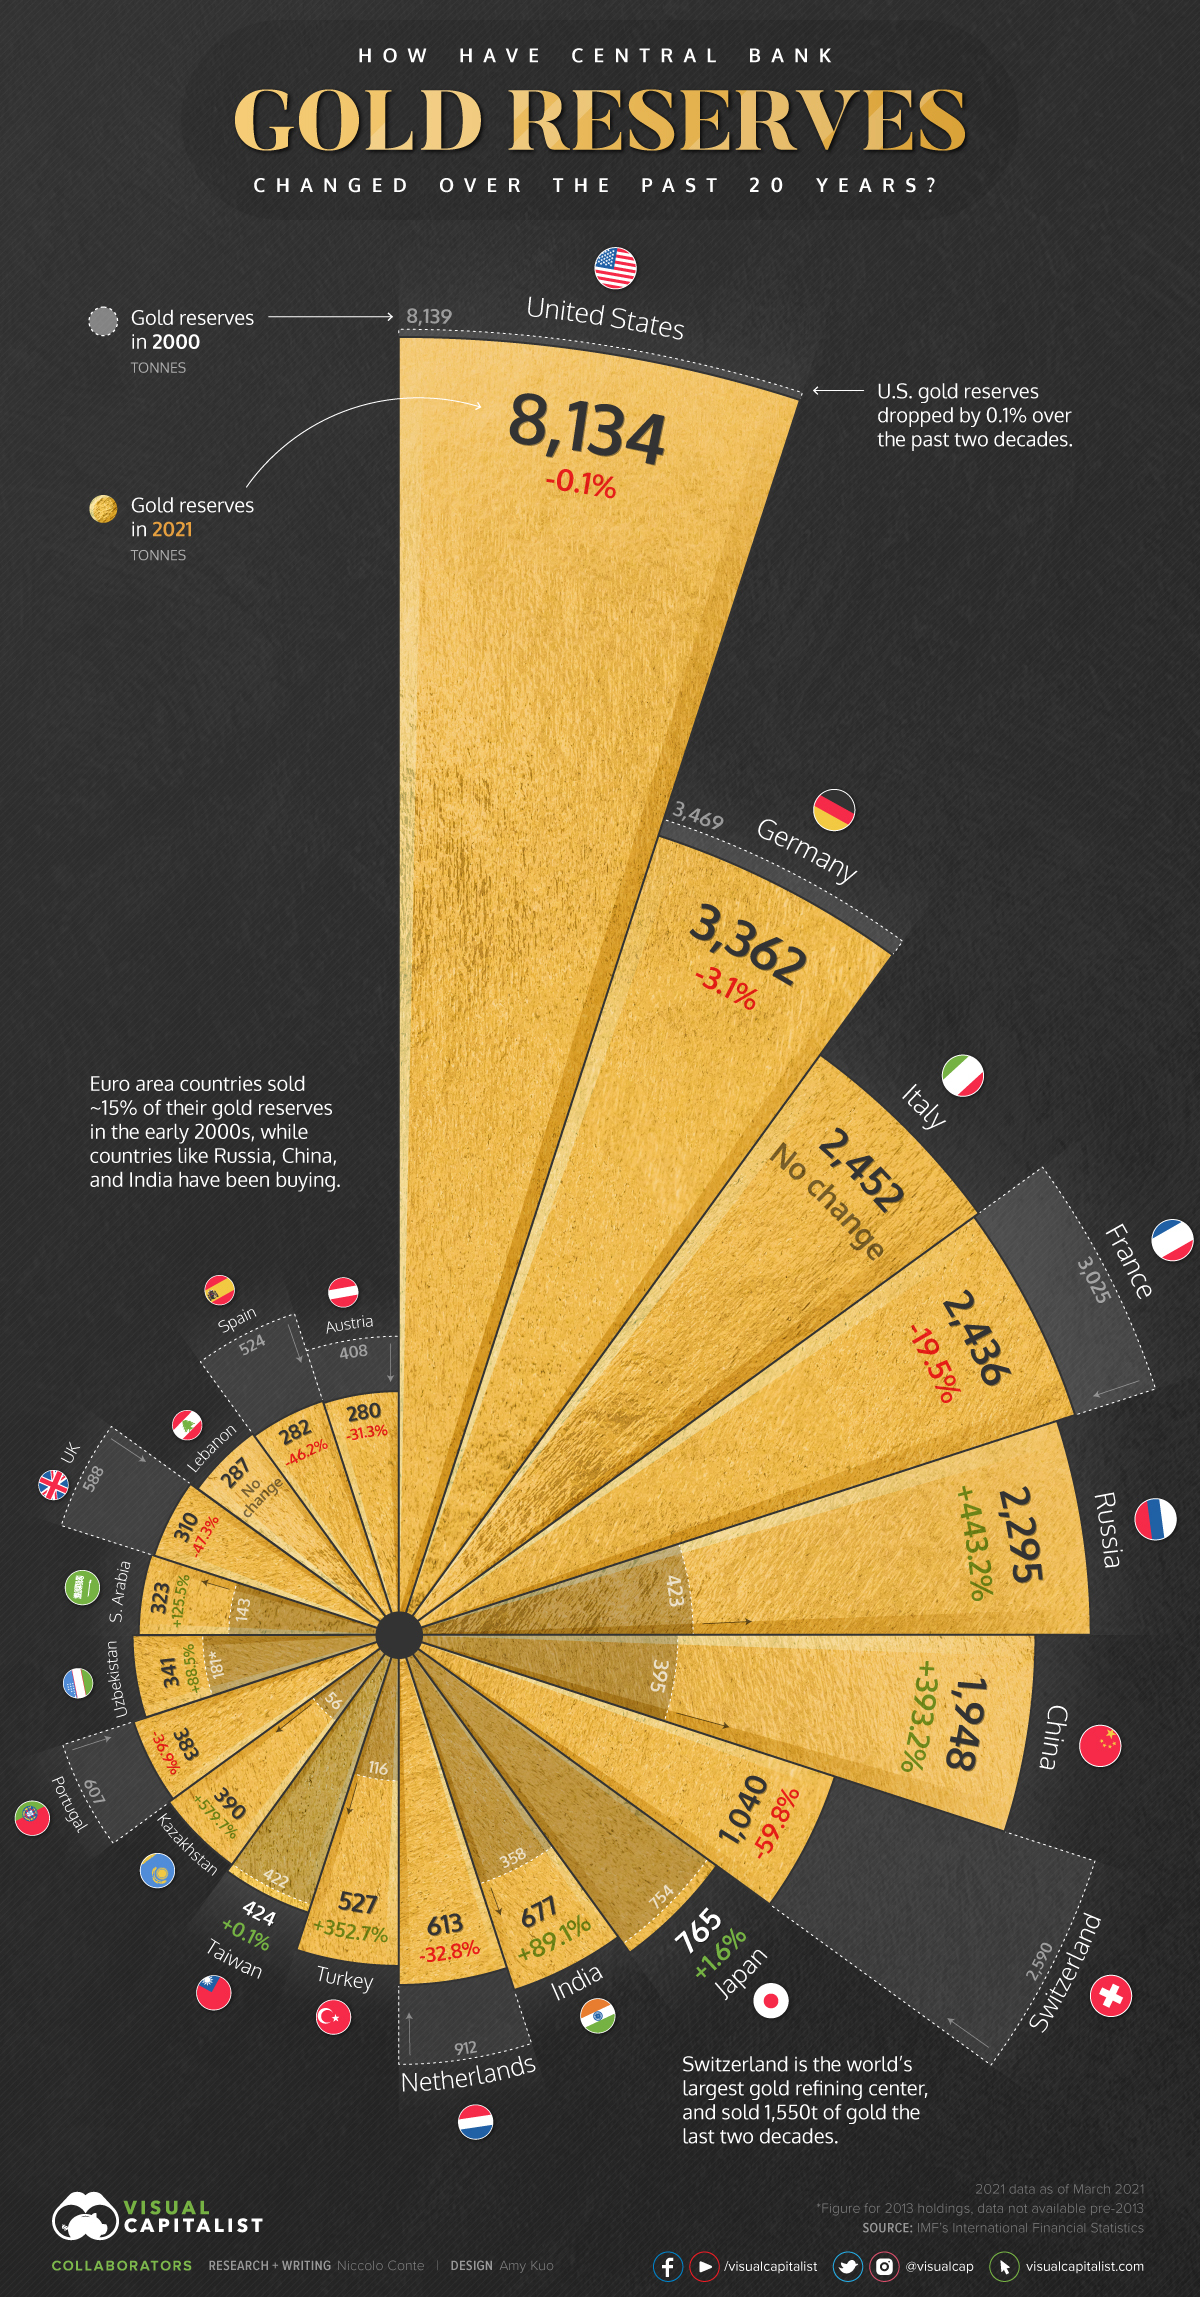
Using data from the IMF’s International Financial Statistics, this infographic looks at the top 20 countries by their central bank’s gold holdings and how their national gold reserves have changed since 2000.
European Nations Sold Gold, but Still Hold Plenty
Many European nations started the millennium by reducing their gold holdings. The Euro Area (including the European Central Bank) sold a total of 1,885.3 tonnes over the past two decades, reducing gold holdings by around 15%.
Despite this, European nations like Germany, Italy, and France still retain some of the largest gold reserves, with Italy not having touched their gold at all over the past 20 years.
After the termination of the Central Bank Gold Agreement in July of 2019, the European Central Bank made it clear that gold is still held in high standard by the Euro Area’s nations:
“The signatories confirm that gold remains an important element of global monetary reserves, as it continues to provide asset diversification benefits and none of them currently has plans to sell significant amounts of gold.”
– ECB
Small Countries, Big Buyers
While nations across Europe sold off some of their central bank gold reserves, smaller countries like Kazakhstan, Cambodia, Kyrgyz Republic, Belarus, Qatar, and Uzbekistan have been some of the biggest gold purchasers relative to their GDP.
Large Gold Purchases of Six Small Nations
| Central Bank Gold Reserves (tonnes) in 2021 | Net Change in Gold Reserves (tonnes) since 2000 | Purchased Gold USD Value (at $1,730/oz) | Nominal GDP in USD | Purchased Gold as a Percentage of GDP | |
|---|---|---|---|---|---|
| Uzbekistan* | 340.6 | +159.9 | $8.89B | $63.30B | 14.0% |
| Kazakhstan | 390.7 | +334.7 | $18.64B | $180.72B | 10.3% |
| Kyrgyz Republic | 16.8 | +14.2 | $0.79B | $8.45B | 9.3% |
| Cambodia | 45.5 | +33.1 | $1.84B | $28.55B | 6.4% |
| Belarus** | 50.0 | +40.7 | $2.26B | $60.97B | 3.7% |
| Qatar | 56.7 | +56.1 | $3.12B | $155.57B | 2.0% |
*Uzbekistan data only available from 2013 onwards
**Belarus data only available from 2002 onwards
Source: IMF World Economic Outlook Database
None of the nations in the table above rank in the top 50 by nominal GDP, however, their central bank reserves have greatly grown in value thanks to their gold accumulation over the past 20 years. Along with this, countries like Uzbekistan are focusing on making gold production and circulation a key part of their economies.
In November of 2020, Uzbekistan introduced a new gold product available at commercial banks to make buying and selling gold more accessible: gold bars weighing 5, 10, 20, and 50 grams in a protective card packaging with a matching QR code for authentication.
As Uzbekistan pushes to become one of the world’s largest gold producers over the next few years, this product reintroduces gold in smaller purchasable amounts for everyday citizens.
A Turkish Delight of Gold Purchases
Since 2017, Turkey has increased gold within their central bank reserves from 116 to 527 tonnes (a 354% increase), while wrestling with rising inflation and a plummeting Turkish lira.
Alongside the central bank’s gold purchases, the Turkish government introduced gold-backed bonds and changes to gold regulations in an attempt to draw out household gold deposits. To further strengthen the nation’s economic independence and cut down gold import costs, Turkey is planning to radically ramp up domestic gold production to 100 tonnes of gold per year.
The country broke records in 2020 with 42 tonnes of gold produced, and the recent discovery of a 3.5M oz gold deposit (valued ~$6B) will help supply the nation’s surging demand for the precious metal.
A Common Trend: Gold is Rising as a Percentage of Reserves
One trend that is common across many nations: gold as a percentage of reserves has risen consistently since Q3 of 2018 as gold’s price has skyrocketed.
Most European central banks have gold reserves above the 50% mark of their reserves despite mostly selling gold over the past two decades. On the other hand, China and India have been aggressively purchasing gold since 2000, and yet gold still remains at single-digit percentages of their total reserves with plenty of room for expansion.
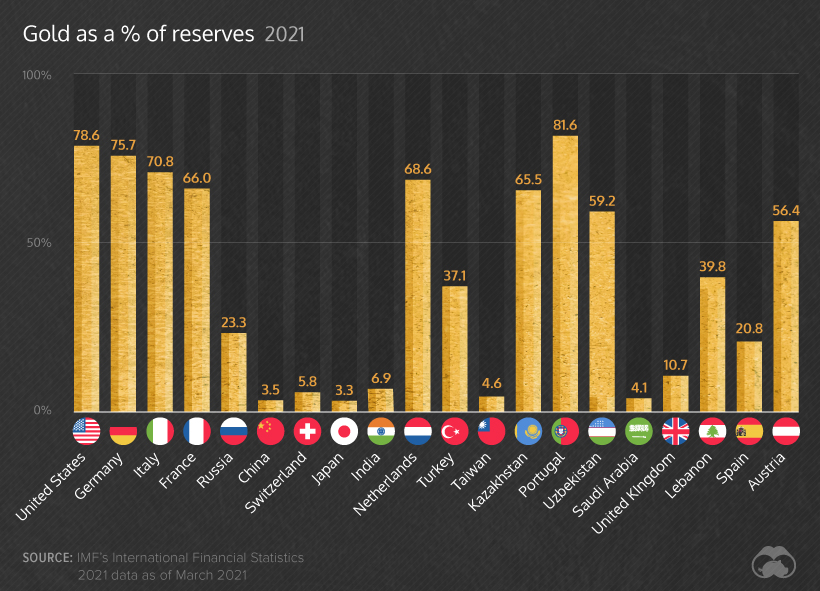
While some major nations’ gold holdings are reaching 70-80% of their reserves, the head of foreign exchange reserves management for the Central Bank of Hungary, Róbert Rékási, doesn’t think that nations are approaching a ceiling for this figure, and that central banks are still willing to increase their gold exposure.
China and Russia’s 20-Year Accumulation
The two nations that have increased their gold exposure the most over these past two decades have been China and Russia, which have purchased 1,553 tonnes (393% increase) and 1,873 tonnes (443% increase) respectively.
These aggressive purchases highlight a potential distancing from a weakening U.S. monetary system. The U.S. dollar was recently overtaken by gold as a percentage of Russian reserves, and has fallen to 25-year lows in global central bank foreign exchange reserves.
As both China and Russia have begun preparing central bank digital currencies, the two nations could be looking to set new monetary standards and strengthen their roles in the world’s evolving financial system.
The Next 20 Years of Gold Reserves
Gold’s value has stagnated over the past few months while bitcoin and equities have taken the spotlight, however, central banks still consider it an essential part of their reserves.
Developing nations and global heavyweights like Russia, China, and India have all been accumulating and prioritizing gold production, and while European countries have sold some gold the past two decades, they still rank among the largest holders of the precious metal.
As central bank digital currencies loom on the horizon, gold still plays an essential role in the composition of national central bank reserves backing these new financial systems, providing a familiar inflation hedge for central banks and investors in these uncertain monetary times.


Real Assets
Visualizing Global Gold Production in 2023
Gold production in 2023 was led by China, Australia, and Russia, with each outputting over 300 tonnes.
Visualizing Global Gold Production in 2023
This was originally posted on our Voronoi app. Download the app for free on iOS or Android and discover incredible data-driven charts from a variety of trusted sources.
Over 3,000 tonnes of gold were produced globally in 2023.
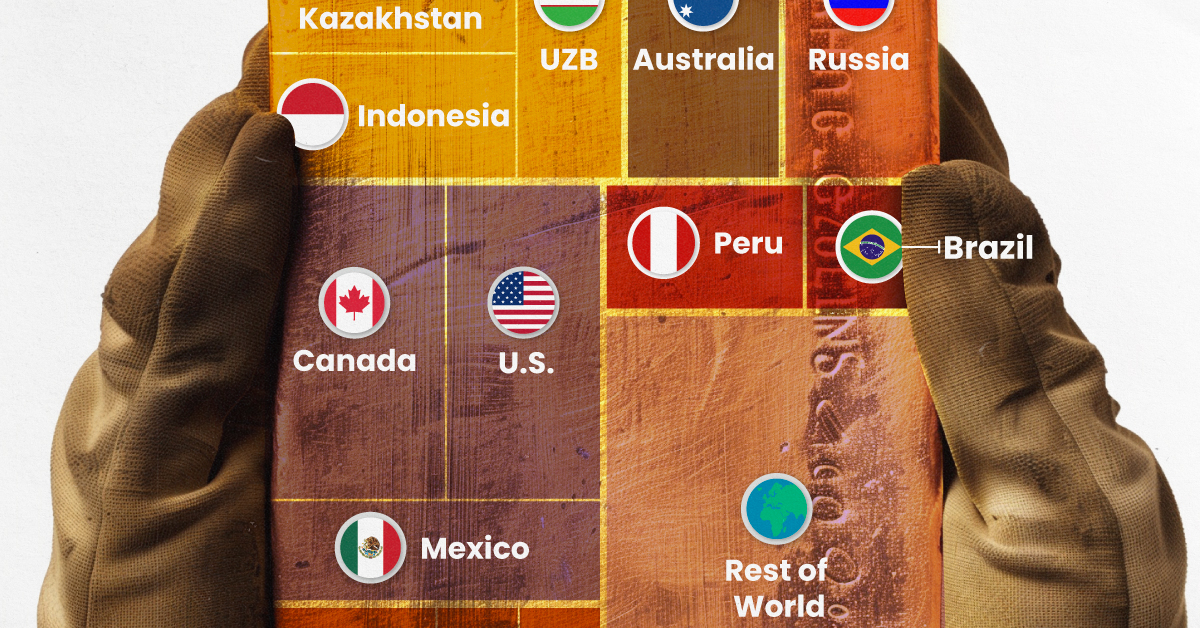
In this graphic, we list the world’s leading countries in terms of gold production. These figures come from the latest USGS publication on gold statistics (published January 2024).
China, Australia, and Russia Produced the Most Gold in 2023
China was the top producer in 2023, responsible for over 12% of total global production, followed by Australia and Russia.
| Country | Region | 2023E Production (tonnes) |
|---|---|---|
| 🇨🇳 China | Asia | 370 |
| 🇦🇺 Australia | Oceania | 310 |
| 🇷🇺 Russia | Europe | 310 |
| 🇨🇦 Canada | North America | 200 |
| 🇺🇸 United States | North America | 170 |
| 🇰🇿 Kazakhstan | Asia | 130 |
| 🇲🇽 Mexico | North America | 120 |
| 🇮🇩 Indonesia | Asia | 110 |
| 🇿🇦 South Africa | Africa | 100 |
| 🇺🇿 Uzbekistan | Asia | 100 |
| 🇬🇭 Ghana | Africa | 90 |
| 🇵🇪 Peru | South America | 90 |
| 🇧🇷 Brazil | South America | 60 |
| 🇧🇫 Burkina Faso | Africa | 60 |
| 🇲🇱 Mali | Africa | 60 |
| 🇹🇿 Tanzania | Africa | 60 |
| 🌍 Rest of World | - | 700 |
Gold mines in China are primarily concentrated in eastern provinces such as Shandong, Henan, Fujian, and Liaoning. As of January 2024, China’s gold mine reserves stand at an estimated 3,000 tonnes, representing around 5% of the global total of 59,000 tonnes.
In addition to being the top producer, China emerged as the largest buyer of the yellow metal for the year. In fact, the country’s central bank alone bought 225 tonnes of gold in 2023, according the World Gold Council.
Estimated Global Gold Consumption
Most of the gold produced in 2023 was used in jewelry production, while another significant portion was sold as a store of value, such as in gold bars or coins.
- Jewelry: 46%
- Central Banks and Institutions: 23%
- Physical Bars: 16%
- Official Coins, Medals, and Imitation Coins: 9%
- Electrical and Electronics: 5%
- Other: 1%
According to Fitch Solutions, over the medium term (2023-2032), global gold mine production is expected to grow 15%, as high prices encourage investment and output.
Real Assets
Charted: The Value Gap Between the Gold Price and Gold Miners
While gold prices hit all-time highs, gold mining stocks have lagged far behind.

Gold Price vs. Gold Mining Stocks
This was originally posted on our Voronoi app. Download the app for free on Apple or Android and discover incredible data-driven charts from a variety of trusted sources.
Although the price of gold has reached new record highs in 2024, gold miners are still far from their 2011 peaks.
In this graphic, we illustrate the evolution of gold prices since 2000 compared to the NYSE Arca Gold BUGS Index (HUI), which consists of the largest and most widely held public gold production companies. The data was compiled by Incrementum AG.
Mining Stocks Lag Far Behind
In April 2024, gold reached a new record high as Federal Reserve Chair Jerome Powell signaled policymakers may delay interest rate cuts until clearer signs of declining inflation materialize.
Additionally, with elections occurring in more than 60 countries in 2024 and ongoing conflicts in Ukraine and Gaza, central banks are continuing to buy gold to strengthen their reserves, creating momentum for the metal.
Traditionally known as a hedge against inflation and a safe haven during times of political and economic uncertainty, gold has climbed over 11% so far this year.
According to Business Insider, gold miners experienced their best performance in a year in March 2024. During that month, the gold mining sector outperformed all other U.S. industries, surpassing even the performance of semiconductor stocks.
Still, physical gold has outperformed shares of gold-mining companies over the past three years by one of the largest margins in decades.
| Year | Gold Price | NYSE Arca Gold BUGS Index (HUI) |
|---|---|---|
| 2023 | $2,062.92 | $243.31 |
| 2022 | $1,824.32 | $229.75 |
| 2021 | $1,828.60 | $258.87 |
| 2020 | $1,895.10 | $299.64 |
| 2019 | $1,523.00 | $241.94 |
| 2018 | $1,281.65 | $160.58 |
| 2017 | $1,296.50 | $192.31 |
| 2016 | $1,151.70 | $182.31 |
| 2015 | $1,060.20 | $111.18 |
| 2014 | $1,199.25 | $164.03 |
| 2013 | $1,201.50 | $197.70 |
| 2012 | $1,664.00 | $444.22 |
| 2011 | $1,574.50 | $498.73 |
| 2010 | $1,410.25 | $573.32 |
| 2009 | $1,104.00 | $429.91 |
| 2008 | $865.00 | $302.41 |
| 2007 | $836.50 | $409.37 |
| 2006 | $635.70 | $338.24 |
| 2005 | $513.00 | $276.90 |
| 2004 | $438.00 | $215.33 |
| 2003 | $417.25 | $242.93 |
| 2002 | $342.75 | $145.12 |
| 2001 | $276.50 | $65.20 |
| 2000 | $272.65 | $40.97 |
Among the largest companies on the NYSE Arca Gold BUGS Index, Colorado-based Newmont has experienced a 24% drop in its share price over the past year. Similarly, Canadian Barrick Gold also saw a decline of 6.5% over the past 12 months.

-

 Electrification3 years ago
Ranked: The Top 10 EV Battery Manufacturers
-

 Electrification2 years ago
The Key Minerals in an EV Battery
-

 Real Assets3 years ago
The World’s Top 10 Gold Mining Companies
-

 Electrification3 years ago
Mapped: Solar Power by Country in 2021
-

 Misc3 years ago
All the Metals We Mined in One Visualization
-

 Energy Shift2 years ago
What Are the Five Major Types of Renewable Energy?
-

 Electrification2 years ago
The World’s Largest Nickel Mining Companies
-

 Misc3 years ago
The Largest Copper Mines in the World by Capacity