

Real Assets
Visualizing $65 Trillion in Hidden Dollar Debt
Visualizing $65 Trillion in Hidden Dollar Debt
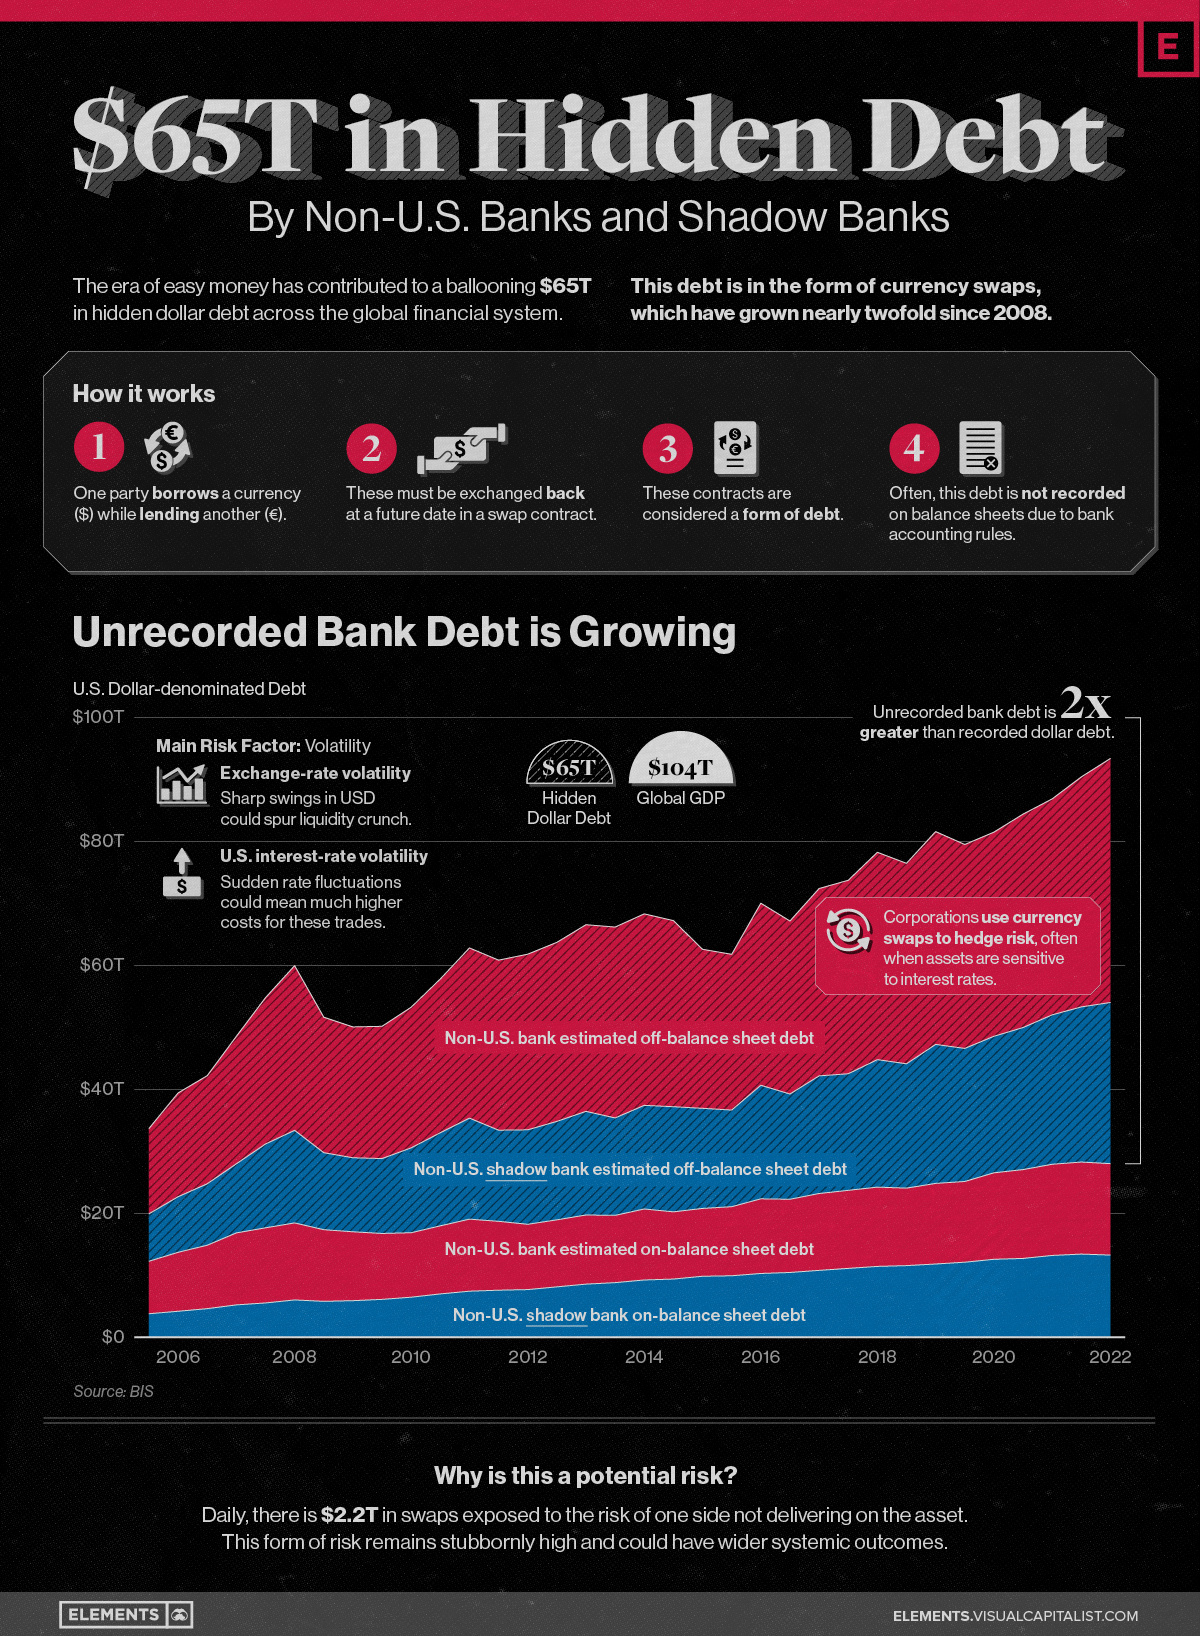
The scale of hidden dollar debt around the world is huge.
No less than $65 trillion in unrecorded dollar debt circulates across the global financial system in non-U.S. banks and shadow banks. To put in perspective, global GDP sits at $104 trillion.
This dollar debt is in the form of foreign-exchange swaps, which have exploded over the last decade due to years of monetary easing and ultra-low interest rates, as investors searched for higher yields. Today, unrecorded debt from these foreign-exchange swaps is worth more than double the dollar debt officially recorded on balance sheets across these institutions.
Based on analysis from the Bank of International Settlements (BIS), the above infographic charts the rise in hidden dollar debt across non-U.S. financial institutions and examines the wider implications of its growth.
Dollar Debt: A Beginners Guide
To start, we will briefly look at the role of foreign-exchange (forex) swaps in the global economy. The forex market is the largest in the world by a long stretch, with trillions traded daily.
Some of the key players that use foreign-exchange swaps are:
- Corporations
- Financial institutions
- Central banks
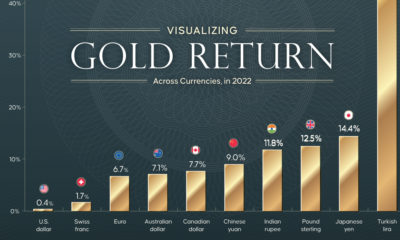
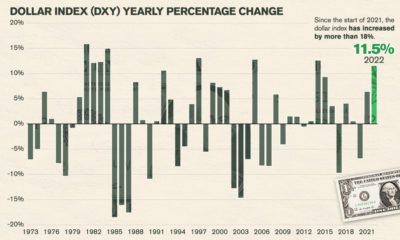
To understand forex swaps is to look at the role of currency risk. As we have seen in 2022, the U.S. dollar has been on a tear. When this happens, it hurts company earnings that generate revenue across borders. That’s because they earn revenue in foreign currencies (which have likely declined in value against the dollar) but end up converting earnings to U.S. dollars.
In order to reduce currency risk, market participants will buy forex swaps. Here, two parties agree to exchange one currency for another. In short, this helps protect the company from unfavorable foreign exchange rates.
What’s more, due to accounting rules, forex swaps are often unrecorded on balance sheets, and as a result are quite opaque.
A Mountain of Debt
Since 2008, the value of this opaque, unrecorded dollar debt has nearly doubled.
| Date | Non-U.S. Bank Unrecorded Debt | Non-U.S. Shadow Bank Unrecorded Debt |
|---|---|---|
| 2022* | $39.4T | $26.0T |
| 2021 | $37.1T | $25.0T |
| 2020 | $34.5T | $22.9T |
| 2019 | $32.9T | $21.5T |
| 2018 | $32.4T | $20.1T |
| 2017 | $31.2T | $18.8T |
| 2016 | $27.9T | $17.0T |
| 2015 | $25.1T | $15.6T |
| 2014 | $30.0T | $17.0T |
| 2013 | $30.8T | $15.7T |
| 2012 | $28.9T | $15.9T |
| 2011 | $27.5T | $14.7T |
| 2010 | $24.8T | $15.0T |
| 2009 | $21.4T | $12.1T |
| 2008 | $21.9T | $12.4T |
*As of June 30, 2022
Driving its rise in part was an era of rock-bottom interest rates globally. As investors sought out higher returns, they took on greater leverage—and forex swaps are one example of this.
Now, as interest rates have been rising, forex swaps have increased amid higher market volatility as investors look to hedge currency risk. This appears in both non-U.S. banks and non-U.S. shadow banks, which are unregulated financial intermediaries.
Overall, the value of unrecorded debt is staggering. An estimated $39 trillion is held by non-U.S. banks along with $26 trillion in overseas shadow banks around the world.
Past Case Studies
Why does the massive growth in dollar debt present risks?
During the market crashes of 2008 and 2020, forex swaps faced a funding squeeze. To borrow U.S. dollars, market participants had to pay high rates. A lot of this hinged on the impact of extreme volatility on these swaps, putting pressure on funding rates.
Here are two examples of how volatility can heighten risk in the forex market:
- Exchange-rate volatility: Sharp swings in USD can spur a liquidity crunch
- U.S. interest-rate volatility: Sudden rate fluctuations can mean much higher costs for these trades
In both cases, the U.S. central bank had to step in to provide liquidity in the market and prevent dollar shortages. This was done through pumping cash into the system and creating swap lines with other non-U.S. banks such as the Bank of Canada or the Bank of Japan. These were designed to protect from declining currency values and a liquidity crunch.
Dollar Debt: The Wider Implications
The risk from growing dollar debt and these swap lines arises when a non-U.S. bank or shadow bank may not be able to hold up their end of the agreement. In fact, on a daily basis, there is an estimated $2.2 trillion in forex swaps exposed to settlement risk.
Given its vast scale, this dollar debt could have greater systemic spillover effects. If participants fail to pay it could undermine financial market stability. Because demand for U.S. dollars increases during market uncertainty, a worsening economic climate could potentially expose the forex market to more vulnerabilities.


Real Assets
Charted: The Value Gap Between the Gold Price and Gold Miners
While gold prices hit all-time highs, gold mining stocks have lagged far behind.

Gold Price vs. Gold Mining Stocks
This was originally posted on our Voronoi app. Download the app for free on Apple or Android and discover incredible data-driven charts from a variety of trusted sources.
Although the price of gold has reached new record highs in 2024, gold miners are still far from their 2011 peaks.
In this graphic, we illustrate the evolution of gold prices since 2000 compared to the NYSE Arca Gold BUGS Index (HUI), which consists of the largest and most widely held public gold production companies. The data was compiled by Incrementum AG.
Mining Stocks Lag Far Behind
In April 2024, gold reached a new record high as Federal Reserve Chair Jerome Powell signaled policymakers may delay interest rate cuts until clearer signs of declining inflation materialize.
Additionally, with elections occurring in more than 60 countries in 2024 and ongoing conflicts in Ukraine and Gaza, central banks are continuing to buy gold to strengthen their reserves, creating momentum for the metal.
Traditionally known as a hedge against inflation and a safe haven during times of political and economic uncertainty, gold has climbed over 11% so far this year.
According to Business Insider, gold miners experienced their best performance in a year in March 2024. During that month, the gold mining sector outperformed all other U.S. industries, surpassing even the performance of semiconductor stocks.
Still, physical gold has outperformed shares of gold-mining companies over the past three years by one of the largest margins in decades.
| Year | Gold Price | NYSE Arca Gold BUGS Index (HUI) |
|---|---|---|
| 2023 | $2,062.92 | $243.31 |
| 2022 | $1,824.32 | $229.75 |
| 2021 | $1,828.60 | $258.87 |
| 2020 | $1,895.10 | $299.64 |
| 2019 | $1,523.00 | $241.94 |
| 2018 | $1,281.65 | $160.58 |
| 2017 | $1,296.50 | $192.31 |
| 2016 | $1,151.70 | $182.31 |
| 2015 | $1,060.20 | $111.18 |
| 2014 | $1,199.25 | $164.03 |
| 2013 | $1,201.50 | $197.70 |
| 2012 | $1,664.00 | $444.22 |
| 2011 | $1,574.50 | $498.73 |
| 2010 | $1,410.25 | $573.32 |
| 2009 | $1,104.00 | $429.91 |
| 2008 | $865.00 | $302.41 |
| 2007 | $836.50 | $409.37 |
| 2006 | $635.70 | $338.24 |
| 2005 | $513.00 | $276.90 |
| 2004 | $438.00 | $215.33 |
| 2003 | $417.25 | $242.93 |
| 2002 | $342.75 | $145.12 |
| 2001 | $276.50 | $65.20 |
| 2000 | $272.65 | $40.97 |
Among the largest companies on the NYSE Arca Gold BUGS Index, Colorado-based Newmont has experienced a 24% drop in its share price over the past year. Similarly, Canadian Barrick Gold also saw a decline of 6.5% over the past 12 months.
Real Assets
200 Years of Global Gold Production, by Country
Global gold production has grown exponentially since the 1800s, with 86% of all above-ground gold mined in the last 200 years.


Visualizing Global Gold Production Over 200 Years
Although the practice of gold mining has been around for thousands of years, it’s estimated that roughly 86% of all above-ground gold was extracted in the last 200 years.
With modern mining techniques making large-scale production possible, global gold production has grown exponentially since the 1800s.
The above infographic uses data from Our World in Data to visualize global gold production by country from 1820 to 2022, showing how gold mining has evolved to become increasingly global over time.
A Brief History of Gold Mining
The best-known gold rush in modern history occurred in California in 1848, when James Marshall discovered gold in Sacramento Valley. As word spread, thousands of migrants flocked to California in search of gold, and by 1855, miners had extracted around $2 billion worth of gold.
The United States, Australia, and Russia were (interchangeably) the three largest gold producers until the 1890s. Then, South Africa took the helm thanks to the massive discovery in the Witwatersrand Basin, now regarded today as one of the world’s greatest ever goldfields.
South Africa’s annual gold production peaked in 1970 at 1,002 tonnes—by far the largest amount of gold produced by any country in a year.
With the price of gold rising since the 1980s, global gold production has become increasingly widespread. By 2007, China was the world’s largest gold-producing nation, and today a significant quantity of gold is being mined in over 40 countries.
The Top Gold-Producing Countries in 2022
Around 31% of the world’s gold production in 2022 came from three countries—China, Russia, and Australia, with each producing over 300 tonnes of the precious metal.
| Rank | Country | 2022E Gold Production, tonnes | % of Total |
|---|---|---|---|
| #1 | 🇨🇳 China | 330 | 11% |
| #2 | 🇷🇺 Russia | 320 | 10% |
| #3 | 🇦🇺 Australia | 320 | 10% |
| #4 | 🇨🇦 Canada | 220 | 7% |
| #5 | 🇺🇸 United States | 170 | 5% |
| #6 | 🇲🇽 Mexico | 120 | 4% |
| #7 | 🇰🇿 Kazakhstan | 120 | 4% |
| #8 | 🇿🇦 South Africa | 110 | 4% |
| #9 | 🇵🇪 Peru | 100 | 3% |
| #10 | 🇺🇿 Uzbekistan | 100 | 3% |
| #11 | 🇬🇭 Ghana | 90 | 3% |
| #12 | 🇮🇩 Indonesia | 70 | 2% |
| - | 🌍 Rest of the World | 1,030 | 33% |
| - | World Total | 3,100 | 100% |
North American countries Canada, the U.S., and Mexico round out the top six gold producers, collectively making up 16% of the global total. The state of Nevada alone accounted for 72% of U.S. production, hosting the world’s largest gold mining complex (including six mines) owned by Nevada Gold Mines.
Meanwhile, South Africa produced 110 tonnes of gold in 2022, down by 74% relative to its output of 430 tonnes in 2000. This long-term decline is the result of mine closures, maturing assets, and industrial conflict, according to the World Gold Council.
Interestingly, two smaller gold producers on the list, Uzbekistan and Indonesia, host the second and third-largest gold mining operations in the world, respectively.
The Outlook for Global Gold Production
As of April 25, gold prices were hovering around the $2,000 per ounce mark and nearing all-time highs. For mining companies, higher gold prices can mean more profits per ounce if costs remain unaffected.
According to the World Gold Council, mined gold production is expected to increase in 2023 and could surpass the record set in 2018 (3,300 tonnes), led by the expansion of existing projects in North America. The chances of record mine output could be higher if gold prices continue to increase.

-

 Electrification3 years ago
Ranked: The Top 10 EV Battery Manufacturers
-

 Electrification2 years ago
The Key Minerals in an EV Battery
-

 Real Assets3 years ago
The World’s Top 10 Gold Mining Companies
-

 Misc3 years ago
All the Metals We Mined in One Visualization
-

 Electrification3 years ago
The Biggest Mining Companies in the World in 2021
-

 Energy Shift2 years ago
What Are the Five Major Types of Renewable Energy?
-

 Electrification2 years ago
Mapped: Solar Power by Country in 2021
-

 Electrification2 years ago
The World’s Largest Nickel Mining Companies