

Real Assets
The Top 10 Best and Worst-Performing Commodities of 2022
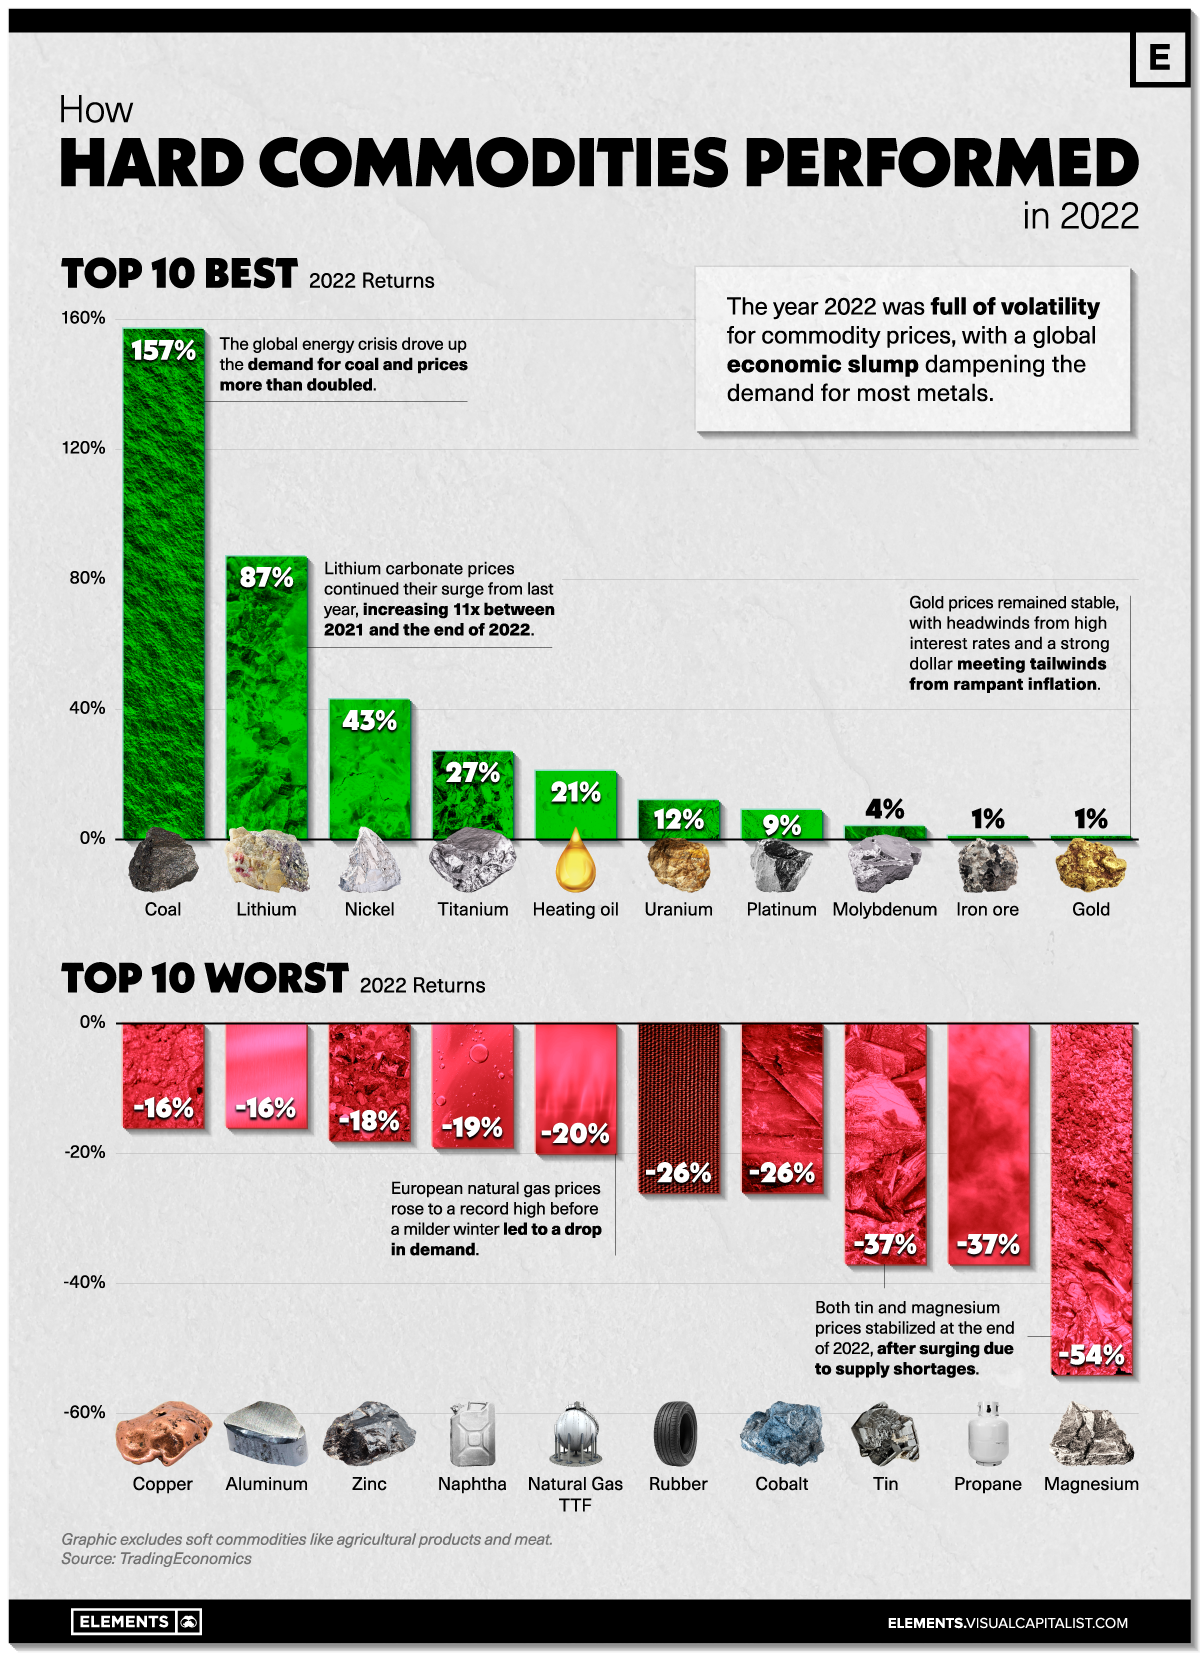
Top 10 Best and Worst-Performing Commodities of 2022
Hard commodities had a roller coaster year in 2022.
While prices for some commodities stabilized after skyrocketing on the heels of the pandemic, others delivered stellar returns. Behind the volatility was a plethora of factors, including the Russia-Ukraine war, the global economic slump, and a drop in China’s demand for materials.
This chart uses price data from TradingEconomics to highlight the 10 best and worst performing hard commodities of 2022. It excludes soft commodities like agricultural products and meat.
Energy Crisis Sets Coal on Fire
The global economic rebound of 2021, which set the fastest post-recession growth pace in the last 80 years, sparked coal prices as energy demand increased. Russia’s invasion of Ukraine ignited the spark, with coal prices exploding 157% in 2022.
Consequently, coal was the best performing commodity in 2022, far outperforming the other nine top commodities by returns.
| Rank | Commodity | 2022 Returns |
|---|---|---|
| #1 | Coal | 157% |
| #2 | Lithium | 87% |
| #3 | Nickel | 43% |
| #4 | Titanium | 27% |
| #5 | Heating oil | 21% |
| #6 | Uranium | 12% |
| #7 | Platinum | 9% |
| #8 | Molybdenum | 4% |
| #9 | Iron ore | 1% |
| #10 | Gold | 1% |
Lithium (carbonate) and nickel prices continue to be supercharged by the demand for EVs and batteries. Since the beginning of 2021, lithium prices have increased 11-fold, and remain elevated at more than $70,000 per tonne.
As a result of high prices for lithium, nickel, and other battery metals, the average cost of lithium-ion battery packs increased in 2022, for the first time since 2010. Battery pack prices are expected to increase in 2023 as well, before falling in 2024.
The year was also positive for uranium as countries revived their nuclear power plans to combat the energy crunch. Notably, Germany extended the lifetime of three plants that were set to shut down in 2022, and Japan announced accelerated restarts for several idle reactors.
What About Crude Oil?
Crude oil is by far the biggest commodity market, and oil prices were the talk of the town for much of 2022.
Following Russia’s invasion of Ukraine, WTI crude oil prices rose to their highest level since 2013 by May 2022. However, between June and the end of December, prices fell from around $116 per barrel to $80 per barrel (a 31% fall). Overall, in 2022, crude oil delivered a -3% return.
The erasure of oil’s initial gains can be attributed to the slowdown in economic growth globally, in addition to strict COVID-19 lockdowns in China.
The 10 Biggest Commodity Drawdowns
The negative returns for most commodities can be largely attributed to prices stabilizing at lower levels after bullish runs in 2021 and the beginning of 2022.
| Rank | Commodity | 2022 Returns |
|---|---|---|
| #1 | Magnesium | -54% |
| #2 | Tin | -37% |
| #3 | Propane | -37% |
| #4 | Rubber | -26% |
| #5 | Cobalt | -26% |
| #6 | Natural Gas TTF | -20% |
| #7 | Naphtha | -19% |
| #8 | Zinc | -18% |
| #9 | Copper | -16% |
| #10 | Aluminum | -16% |
For example, magnesium prices more than halved in 2022, declining from an all-time high in September 2021. Similarly, tin prices also normalized after rising due to unprecedented demand from the electronics sector during the economic rebound from the pandemic.
The volatility in European natural gas (TTF gas) was one of the highlights of the year. Prices rose to around €340 per megawatt-hour in August as the region looked to cut its reliance on Russia. However, they have since fallen due to milder temperatures in winter and the overall drop in energy demand. Still, on average, TTF prices were 150% higher in 2022 than in 2021.
Copper prices are known to reflect the state of the global economy. It’s safe to say that they did so in 2022, falling 16% as economic growth slowed down and China’s economic activity came to a halt at various times due to Zero-COVID policies.
How Will Commodities Perform in 2023?
According to Goldman Sachs, commodity markets have a bullish outlook for 2023, mainly due to underinvestment and the lack of supply response in 2022.
Rising interest rates worldwide increased the cost of capital in 2022, which drained money from commodity markets. Therefore, supply shortages are expected to persist. As China reopens and eases its lockdown measures, the demand for hard commodities is likely to rebound, putting upward pressure on prices.
J.P. Morgan has similar expectations. The bank expects oil prices to rise due to an increase in demand but projects a “transitional year” for base metals, with prices expected to remain relatively stable. The outlook for precious metals is more positive, with gold prices expected to hover around $1,860 per ounce towards the end of 2023.
Of course, commodity markets are volatile. With various geopolitical and macroeconomic moving parts, it’ll be interesting to see what this year has in store for fuels and metals.


Real Assets
Charted: The Value Gap Between the Gold Price and Gold Miners
While gold prices hit all-time highs, gold mining stocks have lagged far behind.

Gold Price vs. Gold Mining Stocks
This was originally posted on our Voronoi app. Download the app for free on Apple or Android and discover incredible data-driven charts from a variety of trusted sources.
Although the price of gold has reached new record highs in 2024, gold miners are still far from their 2011 peaks.
In this graphic, we illustrate the evolution of gold prices since 2000 compared to the NYSE Arca Gold BUGS Index (HUI), which consists of the largest and most widely held public gold production companies. The data was compiled by Incrementum AG.
Mining Stocks Lag Far Behind
In April 2024, gold reached a new record high as Federal Reserve Chair Jerome Powell signaled policymakers may delay interest rate cuts until clearer signs of declining inflation materialize.
Additionally, with elections occurring in more than 60 countries in 2024 and ongoing conflicts in Ukraine and Gaza, central banks are continuing to buy gold to strengthen their reserves, creating momentum for the metal.
Traditionally known as a hedge against inflation and a safe haven during times of political and economic uncertainty, gold has climbed over 11% so far this year.
According to Business Insider, gold miners experienced their best performance in a year in March 2024. During that month, the gold mining sector outperformed all other U.S. industries, surpassing even the performance of semiconductor stocks.
Still, physical gold has outperformed shares of gold-mining companies over the past three years by one of the largest margins in decades.
| Year | Gold Price | NYSE Arca Gold BUGS Index (HUI) |
|---|---|---|
| 2023 | $2,062.92 | $243.31 |
| 2022 | $1,824.32 | $229.75 |
| 2021 | $1,828.60 | $258.87 |
| 2020 | $1,895.10 | $299.64 |
| 2019 | $1,523.00 | $241.94 |
| 2018 | $1,281.65 | $160.58 |
| 2017 | $1,296.50 | $192.31 |
| 2016 | $1,151.70 | $182.31 |
| 2015 | $1,060.20 | $111.18 |
| 2014 | $1,199.25 | $164.03 |
| 2013 | $1,201.50 | $197.70 |
| 2012 | $1,664.00 | $444.22 |
| 2011 | $1,574.50 | $498.73 |
| 2010 | $1,410.25 | $573.32 |
| 2009 | $1,104.00 | $429.91 |
| 2008 | $865.00 | $302.41 |
| 2007 | $836.50 | $409.37 |
| 2006 | $635.70 | $338.24 |
| 2005 | $513.00 | $276.90 |
| 2004 | $438.00 | $215.33 |
| 2003 | $417.25 | $242.93 |
| 2002 | $342.75 | $145.12 |
| 2001 | $276.50 | $65.20 |
| 2000 | $272.65 | $40.97 |
Among the largest companies on the NYSE Arca Gold BUGS Index, Colorado-based Newmont has experienced a 24% drop in its share price over the past year. Similarly, Canadian Barrick Gold also saw a decline of 6.5% over the past 12 months.
Real Assets
200 Years of Global Gold Production, by Country
Global gold production has grown exponentially since the 1800s, with 86% of all above-ground gold mined in the last 200 years.


Visualizing Global Gold Production Over 200 Years
Although the practice of gold mining has been around for thousands of years, it’s estimated that roughly 86% of all above-ground gold was extracted in the last 200 years.
With modern mining techniques making large-scale production possible, global gold production has grown exponentially since the 1800s.
The above infographic uses data from Our World in Data to visualize global gold production by country from 1820 to 2022, showing how gold mining has evolved to become increasingly global over time.
A Brief History of Gold Mining
The best-known gold rush in modern history occurred in California in 1848, when James Marshall discovered gold in Sacramento Valley. As word spread, thousands of migrants flocked to California in search of gold, and by 1855, miners had extracted around $2 billion worth of gold.
The United States, Australia, and Russia were (interchangeably) the three largest gold producers until the 1890s. Then, South Africa took the helm thanks to the massive discovery in the Witwatersrand Basin, now regarded today as one of the world’s greatest ever goldfields.
South Africa’s annual gold production peaked in 1970 at 1,002 tonnes—by far the largest amount of gold produced by any country in a year.
With the price of gold rising since the 1980s, global gold production has become increasingly widespread. By 2007, China was the world’s largest gold-producing nation, and today a significant quantity of gold is being mined in over 40 countries.
The Top Gold-Producing Countries in 2022
Around 31% of the world’s gold production in 2022 came from three countries—China, Russia, and Australia, with each producing over 300 tonnes of the precious metal.
| Rank | Country | 2022E Gold Production, tonnes | % of Total |
|---|---|---|---|
| #1 | 🇨🇳 China | 330 | 11% |
| #2 | 🇷🇺 Russia | 320 | 10% |
| #3 | 🇦🇺 Australia | 320 | 10% |
| #4 | 🇨🇦 Canada | 220 | 7% |
| #5 | 🇺🇸 United States | 170 | 5% |
| #6 | 🇲🇽 Mexico | 120 | 4% |
| #7 | 🇰🇿 Kazakhstan | 120 | 4% |
| #8 | 🇿🇦 South Africa | 110 | 4% |
| #9 | 🇵🇪 Peru | 100 | 3% |
| #10 | 🇺🇿 Uzbekistan | 100 | 3% |
| #11 | 🇬🇭 Ghana | 90 | 3% |
| #12 | 🇮🇩 Indonesia | 70 | 2% |
| - | 🌍 Rest of the World | 1,030 | 33% |
| - | World Total | 3,100 | 100% |
North American countries Canada, the U.S., and Mexico round out the top six gold producers, collectively making up 16% of the global total. The state of Nevada alone accounted for 72% of U.S. production, hosting the world’s largest gold mining complex (including six mines) owned by Nevada Gold Mines.
Meanwhile, South Africa produced 110 tonnes of gold in 2022, down by 74% relative to its output of 430 tonnes in 2000. This long-term decline is the result of mine closures, maturing assets, and industrial conflict, according to the World Gold Council.
Interestingly, two smaller gold producers on the list, Uzbekistan and Indonesia, host the second and third-largest gold mining operations in the world, respectively.
The Outlook for Global Gold Production
As of April 25, gold prices were hovering around the $2,000 per ounce mark and nearing all-time highs. For mining companies, higher gold prices can mean more profits per ounce if costs remain unaffected.
According to the World Gold Council, mined gold production is expected to increase in 2023 and could surpass the record set in 2018 (3,300 tonnes), led by the expansion of existing projects in North America. The chances of record mine output could be higher if gold prices continue to increase.

-

 Electrification3 years ago
Ranked: The Top 10 EV Battery Manufacturers
-

 Electrification2 years ago
The Key Minerals in an EV Battery
-

 Real Assets2 years ago
The World’s Top 10 Gold Mining Companies
-

 Misc3 years ago
All the Metals We Mined in One Visualization
-

 Electrification3 years ago
The Biggest Mining Companies in the World in 2021
-

 Energy Shift2 years ago
What Are the Five Major Types of Renewable Energy?
-

 Electrification2 years ago
The World’s Largest Nickel Mining Companies
-

 Electrification2 years ago
Mapped: Solar Power by Country in 2021