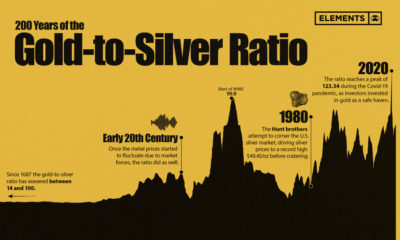

The gold-to-silver ratio used to define the value of currencies and still remains an important metric for metals investors today.
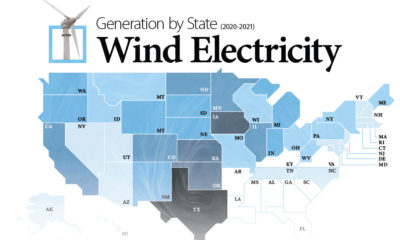

Wind energy is the largest source of renewable electricity in North America. This graphic maps U.S. states by wind electricity generation.
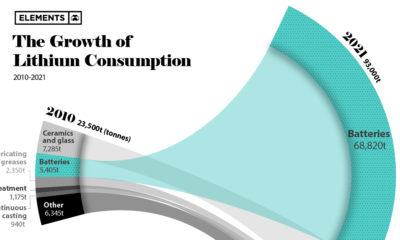

Batteries accounted for 74% of lithium consumption in 2021, up from 23% in 2010.
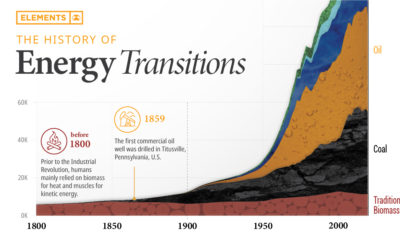

The current energy transition is unprecedented in both scale and speed.
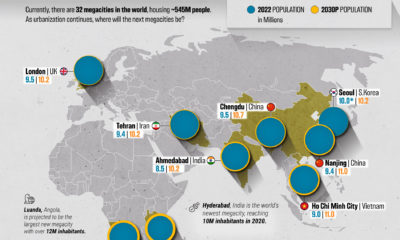

Where will the world's next megacities be by 2030?


Explore North America's crude oil pipelines and refineries across the U.S. and Canada in our interactive map.
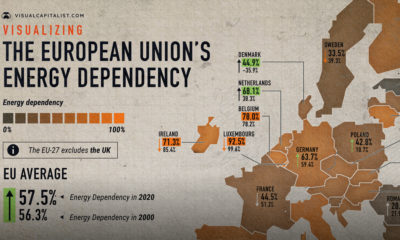

The EU's energy dependency has become a major issue amid Russia's invasion of Ukraine. See what the data says in this infographic.
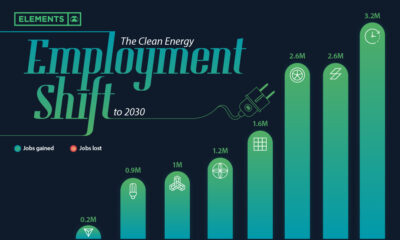

Will the clean energy transition create jobs, or will jobs be lost? Here is projected employment growth in clean energy and related sectors to 2030.
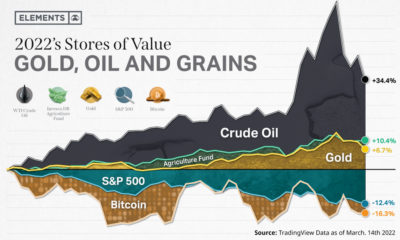

The start of 2022 has seen commodities surge with crude oil, gold, and grains acting as the new stores of value.
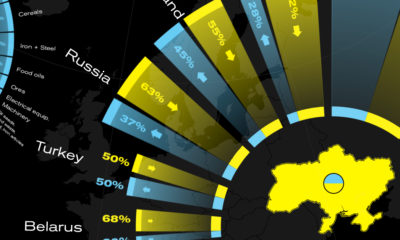

This graphic visualizes Ukraine's top international trading partners and the country's most exported and imported products in 2020.


