

Energy Shift
The History of Energy Transitions
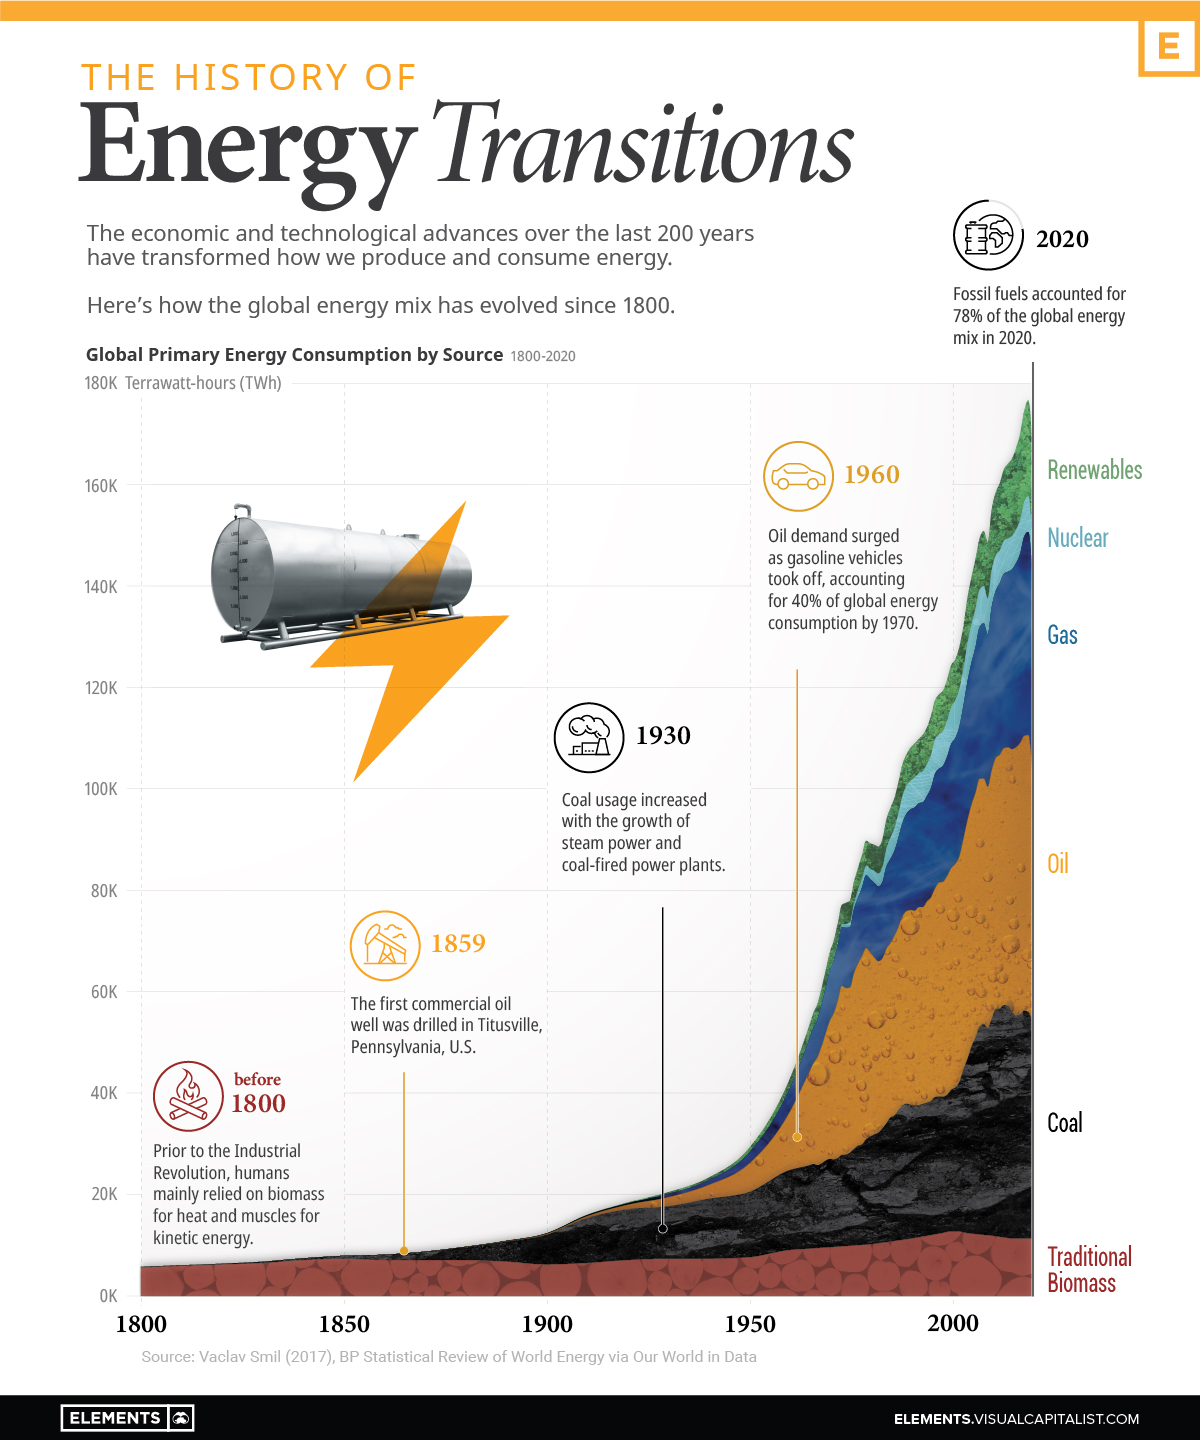
The History of Energy Transitions
Over the last 200 years, how we’ve gotten our energy has changed drastically.
These changes were driven by innovations like the steam engine, oil lamps, internal combustion engines, and the wide-scale use of electricity. The shift from a primarily agrarian global economy to an industrial one called for new sources to provide more efficient energy inputs.
The current energy transition is powered by the realization that avoiding the catastrophic effects of climate change requires a reduction in greenhouse gas emissions. This infographic provides historical context for the ongoing shift away from fossil fuels using data from Our World in Data and scientist Vaclav Smil.
Coal and the First Energy Transition
Before the Industrial Revolution, people burned wood and dried manure to heat homes and cook food, while relying on muscle power, wind, and water mills to grind grains. Transportation was aided by using carts driven by horses or other animals.
In the 16th and 17th centuries, the prices of firewood and charcoal skyrocketed due to shortages. These were driven by increased consumption from both households and industries as economies grew and became more sophisticated.
Consequently, industrializing economies like the UK needed a new, cheaper source of energy. They turned to coal, marking the beginning of the first major energy transition.
| Year | Traditional Biomass % of Energy Mix | Coal % of Energy Mix |
|---|---|---|
| 1800 | 98.3% | 1.7% |
| 1820 | 97.6% | 2.4% |
| 1840 | 95.1% | 4.9% |
| 1860 | 86.8% | 13.3% |
| 1880 | 73.0% | 26.7% |
| 1900 | 50.4% | 47.2% |
| 1920 | 38.4% | 54.4% |
| 1940 | 31.6% | 50.7% |
As coal use and production increased, the cost of producing it fell due to economies of scale. Simultaneously, technological advances and adaptations brought about new ways to use coal.
The steam engine—one of the major technologies behind the Industrial Revolution—was heavily reliant on coal, and homeowners used coal to heat their homes and cook food. This is evident in the growth of coal’s share of the global energy mix, up from 1.7% in 1800 to 47.2% in 1900.
The Rise of Oil and Gas
In 1859, Edwin L. Drake built the first commercial oil well in Pennsylvania, but it was nearly a century later that oil became a major energy source.
Before the mass production of automobiles, oil was mainly used for lamps. Oil demand from internal combustion engine vehicles started climbing after the introduction of assembly lines, and it took off after World War II as vehicle purchases soared.
Similarly, the invention of the Bunsen burner opened up new opportunities to use natural gas in households. As pipelines came into place, gas became a major source of energy for home heating, cooking, water heaters, and other appliances.
| Year | Coal % of Energy Mix | Oil % of Energy Mix | Natural Gas % of Energy Mix |
|---|---|---|---|
| 1950 | 44.2% | 19.1% | 7.3% |
| 1960 | 37.0% | 26.6% | 10.7% |
| 1970 | 25.7% | 40.2% | 14.5% |
| 1980 | 23.8% | 40.6% | 16.3% |
| 1990 | 24.4% | 35.5% | 18.4% |
| 2000 | 22.5% | 35.1% | 19.7% |
Coal lost the home heating market to gas and electricity, and the transportation market to oil.
Despite this, it became the world’s most important source of electricity generation and still accounts for over one-third of global electricity production today.
The Transition to Renewable Energy
Renewable energy sources are at the center of the ongoing energy transition. As countries ramp up their efforts to curb emissions, solar and wind energy capacities are expanding globally.
Here’s how the share of renewables in the global energy mix changed over the last two decades:
| Year | Traditional Biomass | Renewables | Fossil Fuels | Nuclear Power |
|---|---|---|---|---|
| 2000 | 10.2% | 6.6% | 77.3% | 5.9% |
| 2005 | 8.7% | 6.5% | 79.4% | 5.4% |
| 2010 | 7.7% | 7.7% | 79.9% | 4.7% |
| 2015 | 6.9% | 9.2% | 79.9% | 4.0% |
| 2020 | 6.7% | 11.2% | 78.0% | 4.0% |
In the decade between 2000 and 2010, the share of renewables increased by just 1.1%. But the growth is speeding up—between 2010 and 2020, this figure stood at 3.5%.
Furthermore, the current energy transition is unprecedented in both scale and speed, with climate goals requiring net-zero emissions by 2050. That essentially means a complete fade-out of fossil fuels in less than 30 years and an inevitable rapid increase in renewable energy generation.
Renewable energy capacity additions were on track to set an annual record in 2021, following a record year in 2020. Additionally, global energy transition investment hit a record of $755 billion in 2021.
However, history shows that simply adding generation capacity is not enough to facilitate an energy transition. Coal required mines, canals, and railroads; oil required wells, pipelines, and refineries; electricity required generators and an intricate grid.
Similarly, a complete shift to low-carbon sources requires massive investments in natural resources, infrastructure, and grid storage, along with changes in our energy consumption habits.


Energy Shift
The World’s Biggest Oil Producers in 2023
Just three countries accounted for 40% of global oil production last year.

The World’s Biggest Oil Producers in 2023
This was originally posted on our Voronoi app. Download the app for free on iOS or Android and discover incredible data-driven charts from a variety of trusted sources.
Despite efforts to decarbonize the global economy, oil still remains one of the world’s most important resources. It’s also produced by a fairly limited group of countries, which can be a source of economic and political leverage.
This graphic illustrates global crude oil production in 2023, measured in million barrels per day, sourced from the U.S. Energy Information Administration (EIA).
Three Countries Account for 40% of Global Oil Production
In 2023, the United States, Russia, and Saudi Arabia collectively contributed 32.7 million barrels per day to global oil production.
| Oil Production 2023 | Million barrels per day |
|---|---|
| 🇺🇸 U.S. | 12.9 |
| 🇷🇺 Russia | 10.1 |
| 🇸🇦 Saudi Arabia | 9.7 |
| 🇨🇦 Canada | 4.6 |
| 🇮🇶 Iraq | 4.3 |
| 🇨🇳 China | 4.2 |
| 🇮🇷 Iran | 3.6 |
| 🇧🇷 Brazil | 3.4 |
| 🇦🇪 UAE | 3.4 |
| 🇰🇼 Kuwait | 2.7 |
| 🌍 Other | 22.8 |
These three nations have consistently dominated oil production since 1971. The leading position, however, has alternated among them over the past five decades.
In contrast, the combined production of the next three largest producers—Canada, Iraq, and China—reached 13.1 million barrels per day in 2023, just surpassing the production of the United States alone.
In the near term, no country is likely to surpass the record production achieved by the U.S. in 2023, as no other producer has ever reached a daily capacity of 13.0 million barrels. Recently, Saudi Arabia’s state-owned Saudi Aramco scrapped plans to increase production capacity to 13.0 million barrels per day by 2027.
In 2024, analysts forecast that the U.S. will maintain its position as the top oil producer. In fact, according to Macquarie Group, U.S. oil production is expected to achieve a record pace of about 14 million barrels per day by the end of the year.
Energy Shift
How Much Does the U.S. Depend on Russian Uranium?
Despite a new uranium ban being discussed in Congress, the U.S. is still heavily dependent on Russian uranium.

How Much Does the U.S. Depend on Russian Uranium?
This was originally posted on our Voronoi app. Download the app for free on iOS or Android and discover incredible data-driven charts from a variety of trusted sources.
The U.S. House of Representatives recently passed a ban on imports of Russian uranium. The bill must pass the Senate before becoming law.
In this graphic, we visualize how much the U.S. relies on Russian uranium, based on data from the United States Energy Information Administration (EIA).
U.S. Suppliers of Enriched Uranium
After Russia invaded Ukraine, the U.S. imposed sanctions on Russian-produced oil and gas—yet Russian-enriched uranium is still being imported.
Currently, Russia is the largest foreign supplier of nuclear power fuel to the United States. In 2022, Russia supplied almost a quarter of the enriched uranium used to fuel America’s fleet of more than 90 commercial reactors.
| Country of enrichment service | SWU* | % |
|---|---|---|
| 🇺🇸 United States | 3,876 | 27.34% |
| 🇷🇺 Russia | 3,409 | 24.04% |
| 🇩🇪 Germany | 1,763 | 12.40% |
| 🇬🇧 United Kingdom | 1,593 | 11.23% |
| 🇳🇱 Netherlands | 1,303 | 9.20% |
| Other | 2,232 | 15.79% |
| Total | 14,176 | 100% |
SWU stands for “Separative Work Unit” in the uranium industry. It is a measure of the amount of work required to separate isotopes of uranium during the enrichment process. Source: U.S. Energy Information Administration
Most of the remaining uranium is imported from European countries, while another portion is produced by a British-Dutch-German consortium operating in the United States called Urenco.
Similarly, nearly a dozen countries around the world depend on Russia for more than half of their enriched uranium—and many of them are NATO-allied members and allies of Ukraine.
In 2023 alone, the U.S. nuclear industry paid over $800 million to Russia’s state-owned nuclear energy corporation, Rosatom, and its fuel subsidiaries.
It is important to note that 19% of electricity in the U.S. is powered by nuclear plants.
The dependency on Russian fuels dates back to the 1990s when the United States turned away from its own enrichment capabilities in favor of using down-blended stocks of Soviet-era weapons-grade uranium.
As part of the new uranium-ban bill, the Biden administration plans to allocate $2.2 billion for the expansion of uranium enrichment facilities in the United States.

-

 Electrification3 years ago
Ranked: The Top 10 EV Battery Manufacturers
-

 Electrification2 years ago
The Key Minerals in an EV Battery
-

 Real Assets3 years ago
The World’s Top 10 Gold Mining Companies
-

 Misc3 years ago
All the Metals We Mined in One Visualization
-

 Electrification3 years ago
The Biggest Mining Companies in the World in 2021
-

 Energy Shift2 years ago
What Are the Five Major Types of Renewable Energy?
-

 Electrification2 years ago
Mapped: Solar Power by Country in 2021
-

 Electrification2 years ago
The World’s Largest Nickel Mining Companies