

Energy Shift
Mapping U.S. Wind Electricity Generation by State
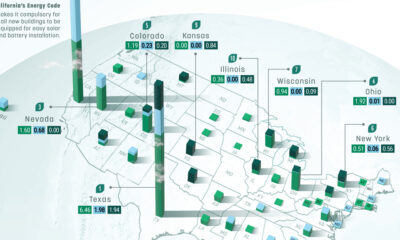
Mapping U.S. Wind Energy by State
Wind power is the most productive renewable energy source in the U.S., generating nearly half of America’s renewable energy.
But wind doesn’t blow fairly across the nation, so which states are contributing the most to U.S. wind energy generation?
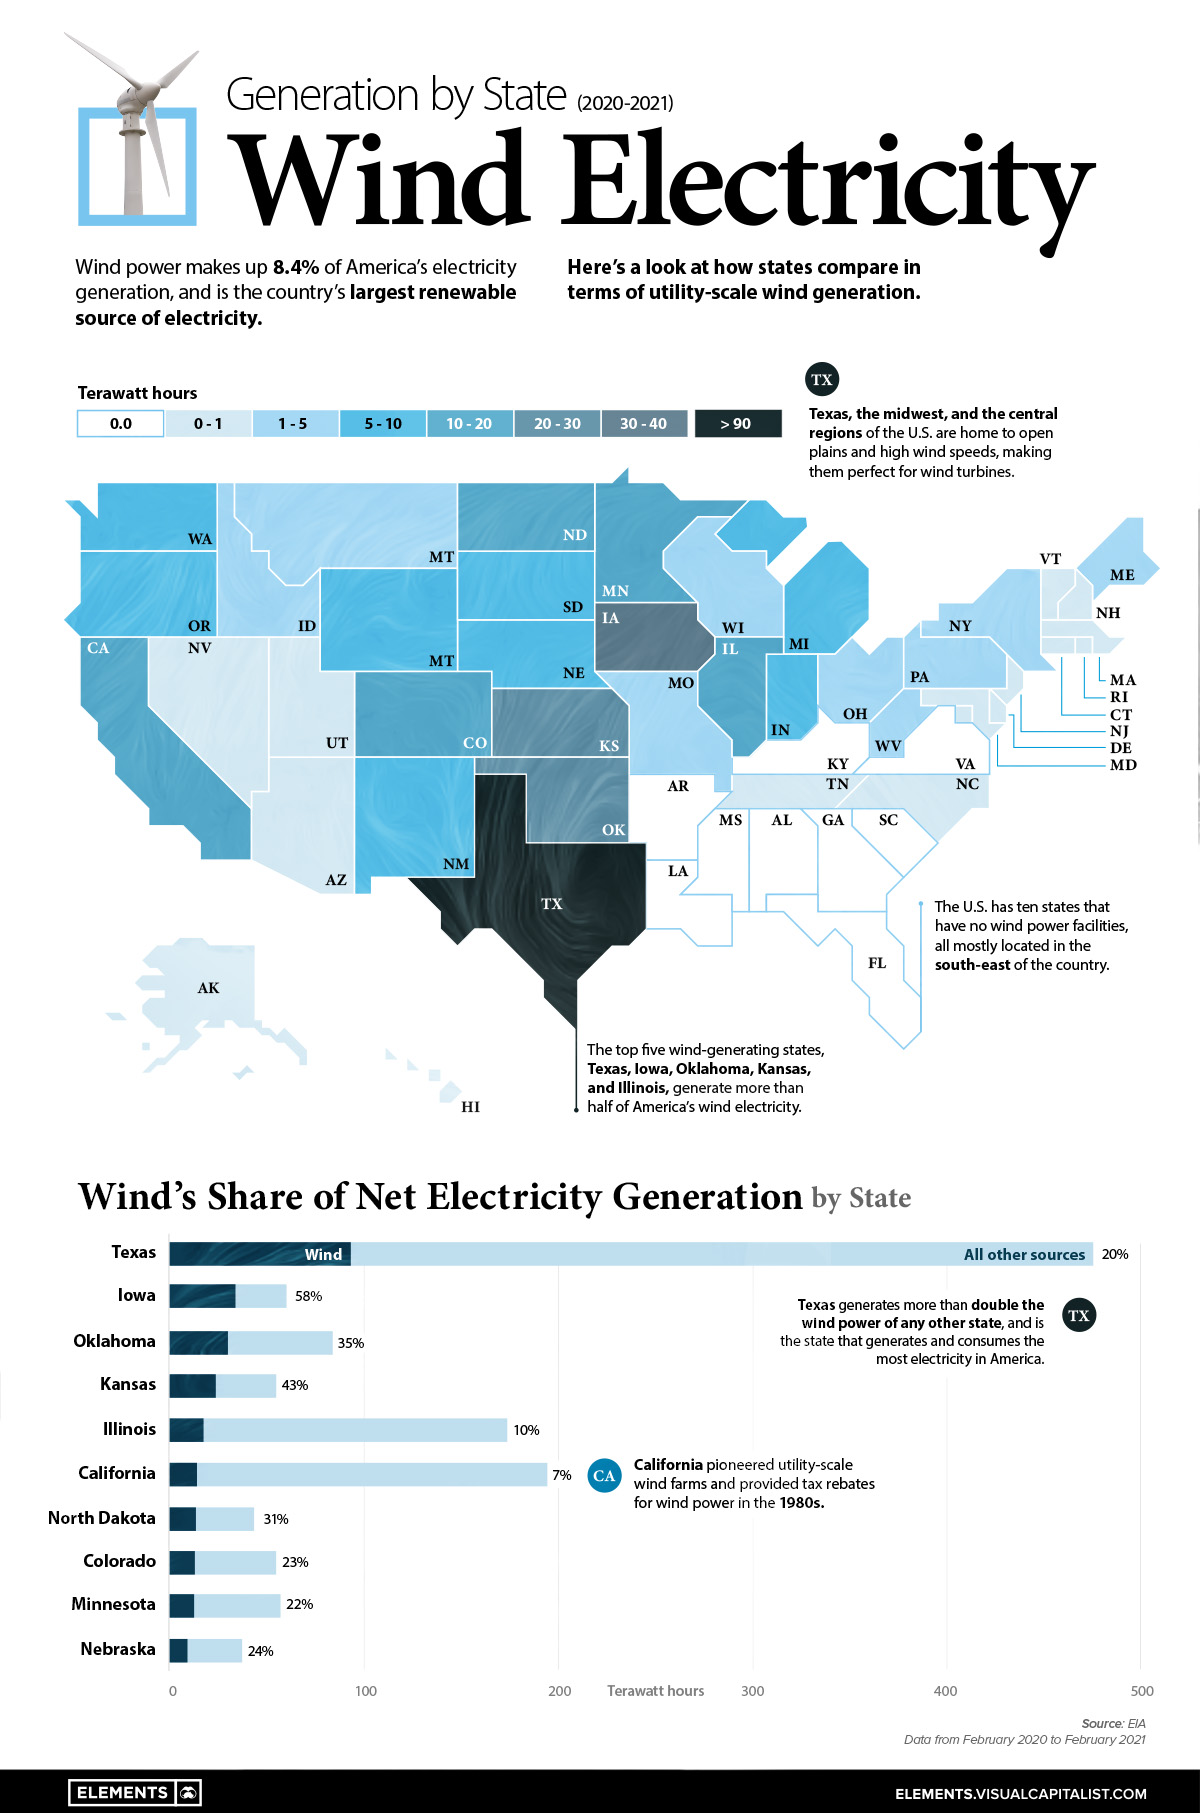
This map uses data from the EIA to show how much wind electricity different U.S. states generate, and breaks down wind’s share of total electricity generation in top wind power producing states.
Wind Electricity Generation by State Compared
America’s wind energy generating states are all primarily located in the Central and Midwest regions of the nation, where wind speeds are highest and most consistent.
Texas is the runaway leader in wind, generating over 92 Terawatt-hours of electricity during a year, more than the next three top states (Iowa, Oklahoma, and Kansas) combined. While Texas is the top generator in terms of wind-powered electricity, wind only makes up 20% of the state’s total electricity generation.
| State | Wind Electricity Generation (Terawatt hours) | Wind's Share of Net Electricity Generation |
|---|---|---|
| Texas | 92.9 TWh | 20% |
| Iowa | 34.1 TWh | 58% |
| Oklahoma | 29.6 TWh | 35% |
| Kansas | 23.5 TWh | 43% |
| Illinois | 17.1 TWh | 10% |
| California | 13.6 TWh | 7% |
| North Dakota | 13.2 TWh | 31% |
| Colorado | 12.7 TWh | 23% |
| Minnesota | 12.2 TWh | 22% |
| Nebraska | 8.7 TWh | 24% |
Data from Feb 2020-Feb 2021
Source: EIA
Meanwhile, wind makes up a much larger share of net electricity generation in states like Iowa (58%), Oklahoma (35%), and Kansas (43%). For both Iowa and Kansas, wind is the primary energy source of in-state electricity generation after overtaking coal in 2019.
The U.S. also has 10 states with no wind power generating facilities, all primarily located in the Southeast region.
How Does Wind Energy Work?
Humans have been harnessing wind power for millennia, with windmills originally relying on wind to pump water or mill flour.
Today’s wind turbines work similarly, with their large blades generating electricity as wind causes them to rotate. As these blades are pushed by the wind, a connected internal shaft that is attached to an electric generator also turns and generates electricity.
Wind power is one of the safest sources of energy and relies on one key factor: wind speeds. When analyzing minimum wind speeds for economic viability in a given location, the following annual average wind speeds are needed:
- Small wind turbines: Minimum of 4 meters per second (9 miles per hour)
- Utility-scale wind turbines: Minimum of 5.8 meters per second (13 miles per hour)
Source: EIA
Unsurprisingly, the majority of America’s onshore wind turbine infrastructure is located in the middle of the nation, where wind speeds are highest.
Growing America’s Wind Turbine Capacity
While wind energy only made up 0.2% of U.S. electricity generating capacity in 1990, it is now essential for the clean energy transition. Today, wind power makes up more than 10% of U.S. electricity generating capacity, and this share is set to continue growing.
Record-breaking wind turbine installations in 2020 and 2021, primarily in the Central and Midwest regions, have increased U.S. wind energy generation by 30% to 135.1 GW.
In 2020, the U.S. increased wind turbine capacity by 14.2 gigawatts, followed by another 17.1 gigawatts in 2021. This year is set to see another 7.6 GW come online, with around half of 2022’s added capacity located in Texas.
After two years of record-breaking wind turbine installations, 2021’s expiration of the U.S. production tax credit is likely to dampen the rate of future installations.


Energy Shift
The World’s Biggest Oil Producers in 2023
Just three countries accounted for 40% of global oil production last year.

The World’s Biggest Oil Producers in 2023
This was originally posted on our Voronoi app. Download the app for free on iOS or Android and discover incredible data-driven charts from a variety of trusted sources.
Despite efforts to decarbonize the global economy, oil still remains one of the world’s most important resources. It’s also produced by a fairly limited group of countries, which can be a source of economic and political leverage.
This graphic illustrates global crude oil production in 2023, measured in million barrels per day, sourced from the U.S. Energy Information Administration (EIA).
Three Countries Account for 40% of Global Oil Production
In 2023, the United States, Russia, and Saudi Arabia collectively contributed 32.7 million barrels per day to global oil production.
| Oil Production 2023 | Million barrels per day |
|---|---|
| 🇺🇸 U.S. | 12.9 |
| 🇷🇺 Russia | 10.1 |
| 🇸🇦 Saudi Arabia | 9.7 |
| 🇨🇦 Canada | 4.6 |
| 🇮🇶 Iraq | 4.3 |
| 🇨🇳 China | 4.2 |
| 🇮🇷 Iran | 3.6 |
| 🇧🇷 Brazil | 3.4 |
| 🇦🇪 UAE | 3.4 |
| 🇰🇼 Kuwait | 2.7 |
| 🌍 Other | 22.8 |
These three nations have consistently dominated oil production since 1971. The leading position, however, has alternated among them over the past five decades.
In contrast, the combined production of the next three largest producers—Canada, Iraq, and China—reached 13.1 million barrels per day in 2023, just surpassing the production of the United States alone.
In the near term, no country is likely to surpass the record production achieved by the U.S. in 2023, as no other producer has ever reached a daily capacity of 13.0 million barrels. Recently, Saudi Arabia’s state-owned Saudi Aramco scrapped plans to increase production capacity to 13.0 million barrels per day by 2027.
In 2024, analysts forecast that the U.S. will maintain its position as the top oil producer. In fact, according to Macquarie Group, U.S. oil production is expected to achieve a record pace of about 14 million barrels per day by the end of the year.
Energy Shift
How Much Does the U.S. Depend on Russian Uranium?
Despite a new uranium ban being discussed in Congress, the U.S. is still heavily dependent on Russian uranium.

How Much Does the U.S. Depend on Russian Uranium?
This was originally posted on our Voronoi app. Download the app for free on iOS or Android and discover incredible data-driven charts from a variety of trusted sources.
The U.S. House of Representatives recently passed a ban on imports of Russian uranium. The bill must pass the Senate before becoming law.
In this graphic, we visualize how much the U.S. relies on Russian uranium, based on data from the United States Energy Information Administration (EIA).
U.S. Suppliers of Enriched Uranium
After Russia invaded Ukraine, the U.S. imposed sanctions on Russian-produced oil and gas—yet Russian-enriched uranium is still being imported.
Currently, Russia is the largest foreign supplier of nuclear power fuel to the United States. In 2022, Russia supplied almost a quarter of the enriched uranium used to fuel America’s fleet of more than 90 commercial reactors.
| Country of enrichment service | SWU* | % |
|---|---|---|
| 🇺🇸 United States | 3,876 | 27.34% |
| 🇷🇺 Russia | 3,409 | 24.04% |
| 🇩🇪 Germany | 1,763 | 12.40% |
| 🇬🇧 United Kingdom | 1,593 | 11.23% |
| 🇳🇱 Netherlands | 1,303 | 9.20% |
| Other | 2,232 | 15.79% |
| Total | 14,176 | 100% |
SWU stands for “Separative Work Unit” in the uranium industry. It is a measure of the amount of work required to separate isotopes of uranium during the enrichment process. Source: U.S. Energy Information Administration
Most of the remaining uranium is imported from European countries, while another portion is produced by a British-Dutch-German consortium operating in the United States called Urenco.
Similarly, nearly a dozen countries around the world depend on Russia for more than half of their enriched uranium—and many of them are NATO-allied members and allies of Ukraine.
In 2023 alone, the U.S. nuclear industry paid over $800 million to Russia’s state-owned nuclear energy corporation, Rosatom, and its fuel subsidiaries.
It is important to note that 19% of electricity in the U.S. is powered by nuclear plants.
The dependency on Russian fuels dates back to the 1990s when the United States turned away from its own enrichment capabilities in favor of using down-blended stocks of Soviet-era weapons-grade uranium.
As part of the new uranium-ban bill, the Biden administration plans to allocate $2.2 billion for the expansion of uranium enrichment facilities in the United States.

-

 Electrification3 years ago
Ranked: The Top 10 EV Battery Manufacturers
-

 Electrification2 years ago
The Key Minerals in an EV Battery
-

 Real Assets3 years ago
The World’s Top 10 Gold Mining Companies
-

 Misc3 years ago
All the Metals We Mined in One Visualization
-

 Electrification3 years ago
The Biggest Mining Companies in the World in 2021
-

 Energy Shift2 years ago
What Are the Five Major Types of Renewable Energy?
-

 Electrification2 years ago
The World’s Largest Nickel Mining Companies
-

 Electrification2 years ago
Mapped: Solar Power by Country in 2021