

Energy Shift
Rare Earth Elements: Where in the World Are They?


Rare Earths Elements: Where in the World Are They?
Rare earth elements are a group of metals that are critical ingredients for a greener economy, and the location of the reserves for mining are increasingly important and valuable.
This infographic features data from the United States Geological Society (USGS) which reveals the countries with the largest known reserves of rare earth elements (REEs).
What are Rare Earth Metals?
REEs, also called rare earth metals or rare earth oxides, or lanthanides, are a set of 17 silvery-white soft heavy metals.
The 17 rare earth elements are: lanthanum (La), cerium (Ce), praseodymium (Pr), neodymium (Nd), promethium (Pm), samarium (Sm), europium (Eu), gadolinium (Gd), terbium (Tb), dysprosium (Dy), holmium (Ho), erbium (Er), thulium (Tm), ytterbium (Yb), lutetium (Lu), scandium (Sc), and yttrium (Y).
Scandium and yttrium are not part of the lanthanide family, but end users include them because they occur in the same mineral deposits as the lanthanides and have similar chemical properties.
The term “rare earth” is a misnomer as rare earth metals are actually abundant in the Earth’s crust. However, they are rarely found in large, concentrated deposits on their own, but rather among other elements instead.
Rare Earth Elements, How Do They Work?
Most rare earth elements find their uses as catalysts and magnets in traditional and low-carbon technologies. Other important uses of rare earth elements are in the production of special metal alloys, glass, and high-performance electronics.
Alloys of neodymium (Nd) and samarium (Sm) can be used to create strong magnets that withstand high temperatures, making them ideal for a wide variety of mission critical electronics and defense applications.
| End-use | % of 2019 Rare Earth Demand |
|---|---|
| Permanent Magnets | 38% |
| Catalysts | 23% |
| Glass Polishing Powder and Additives | 13% |
| Metallurgy and Alloys | 8% |
| Battery Alloys | 9% |
| Ceramics, Pigments and Glazes | 5% |
| Phosphors | 3% |
| Other | 4% |
The strongest known magnet is an alloy of neodymium with iron and boron. Adding other REEs such as dysprosium and praseodymium can change the performance and properties of magnets.
Hybrid and electric vehicle engines, generators in wind turbines, hard disks, portable electronics and cell phones require these magnets and elements. This role in technology makes their mining and refinement a point of concern for many nations.
For example, one megawatt of wind energy capacity requires 171 kg of rare earths, a single U.S. F-35 fighter jet requires about 427 kg of rare earths, and a Virginia-class nuclear submarine uses nearly 4.2 tonnes.
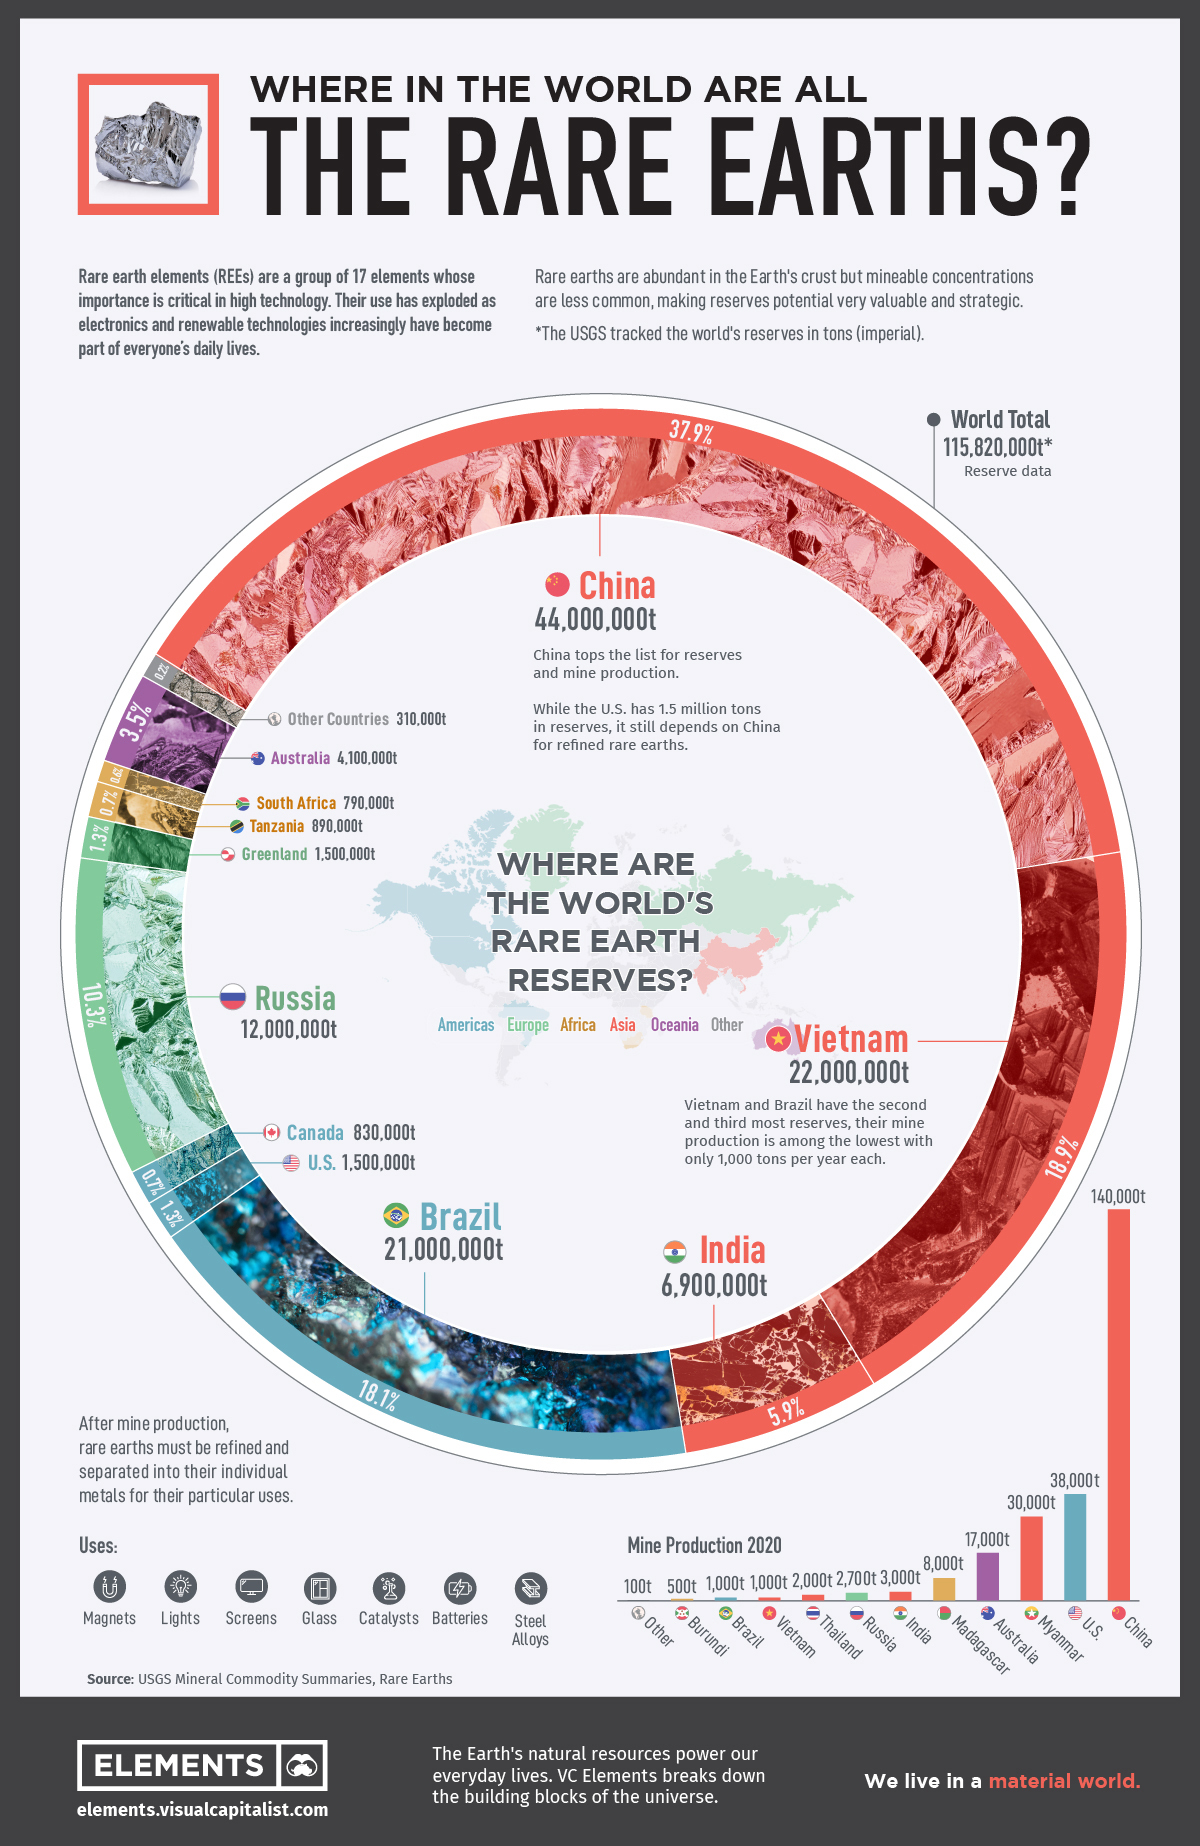
Global Reserves of Rare Earth Minerals
China tops the list for mine production and reserves of rare earth elements, with 44 million tons in reserves and 140,000 tons of annual mine production.
While Vietnam and Brazil have the second and third most reserves of rare earth metals with 22 million tons in reserves and 21 million tons, respectively, their mine production is among the lowest of all the countries at only 1,000 tons per year each.
| Country | Mine Production 2020 | Reserves | % of Total Reserves |
|---|---|---|---|
| China | 140,000 | 44,000,000 | 38.0% |
| Vietnam | 1,000 | 22,000,000 | 19.0% |
| Brazil | 1,000 | 21,000,000 | 18.1% |
| Russia | 2,700 | 12,000,000 | 10.4% |
| India | 3,000 | 6,900,000 | 6.0% |
| Australia | 17,000 | 4,100,000 | 3.5% |
| United States | 38,000 | 1,500,000 | 1.3% |
| Greenland | - | 1,500,000 | 1.3% |
| Tanzania | - | 890,000 | 0.8% |
| Canada | - | 830,000 | 0.7% |
| South Africa | - | 790,000 | 0.7% |
| Other Countries | 100 | 310,000 | 0.3% |
| Burma | 30,000 | N/A | N/A |
| Madagascar | 8,000 | N/A | N/A |
| Thailand | 2,000 | N/A | N/A |
| Burundi | 500 | N/A | N/A |
| World Total | 243,300 | 115,820,000 | 100% |
While the United States has 1.5 million tons in reserves, it is largely dependent on imports from China for refined rare earths.
Ensuring a Global Supply
This tight control of the supply of these important metals has the world searching for their own supplies. With the start of mining operations in other countries, China’s share of global production has fallen from 92% in 2010 to 58%< in 2020. However, China has a strong foothold in the supply chain and produced 85% of the world’s refined rare earths in 2020.
China awards production quotas to only six state-run companies:
- China Minmetals Rare Earth Co
- Chinalco Rare Earth & Metals Co
- Guangdong Rising Nonferrous
- China Northern Rare Earth Group
- China Southern Rare Earth Group
- Xiamen Tungsten
As the demand for REEs increases, the world will need tap these reserves. This graphic could provide clues as to the next source of rare earth elements.


Energy Shift
Visualizing Copper Production by Country in 2023
Chile and Peru account for one-third of the world’s copper output.

Visualizing Copper Production by Country in 2023
This was originally posted on our Voronoi app. Download the app for free on iOS or Android and discover incredible data-driven charts from a variety of trusted sources.
Copper is considered an essential metal for the clean energy transition because it is a great conductor of electricity.
As a result, governments around the world have been encouraging the construction of new mines, and mining companies have been seeking new projects and acquiring existing mines to meet the growing demand.
In this graphic, we illustrate global copper production in 2023, based on data from the U.S. Geological Survey, Mineral Commodity Summaries, as of January 2024.
Most Copper Comes from South America
Chile and Peru account for one-third of the world’s copper output.
| Country | Region | 2023E Production (Million tonnes) |
|---|---|---|
| 🇨🇱 Chile | South America | 5.0 |
| 🇵🇪 Peru | South America | 2.6 |
| 🇨🇩 Congo (Kinshasa) | Africa | 2.5 |
| 🇨🇳 China | Asia | 1.7 |
| 🇺🇸 United States | North America | 1.1 |
| 🇷🇺 Russia | Europe/Asia | 0.9 |
| 🇦🇺 Australia | Oceania | 0.8 |
| 🇮🇩 Indonesia | Asia | 0.8 |
| 🇿🇲 Zambia | Africa | 0.8 |
| 🇲🇽 Mexico | North America | 0.7 |
| 🇰🇿 Kazakhstan | Asia | 0.6 |
| 🇨🇦 Canada | North America | 0.5 |
| 🇵🇱 Poland | Europe | 0.4 |
| 🌍 Rest of World | -- | 3.1 |
| World total (rounded) | -- | 21.5 |
Chile is also home to the two largest mines in the world, Escondida and Collahuasi.
Meanwhile, African countries have rapidly increased their production. The Democratic Republic of Congo, for example, transitioned from being a secondary copper producer in the late 1990s to becoming the third-largest producer by 2023.
Part of the growth in copper mining in Africa is attributed to high investment from China. Chinese mining companies represent 8% of Africa’s total output in the mining sector.
Within its territory, China has also seen a 277% growth in copper production over the last three decades.
In the U.S., Arizona is the leading copper-producing state, accounting for approximately 70% of domestic output. Copper is also mined in Michigan, Missouri, Montana, Nevada, New Mexico, and Utah.
Energy Shift
Who’s Building the Most Solar Energy?
China’s solar capacity triples USA, nearly doubles EU.

Who’s Building the Most Solar Energy?
This was originally posted on our Voronoi app. Download the app for free on iOS or Android and discover incredible data-driven charts from a variety of trusted sources.
In 2023, solar energy accounted for three-quarters of renewable capacity additions worldwide. Most of this growth occurred in Asia, the EU, and the U.S., continuing a trend observed over the past decade.
In this graphic, we illustrate the rise in installed solar photovoltaic (PV) capacity in China, the EU, and the U.S. between 2010 and 2022, measured in gigawatts (GW). Bruegel compiled the data..
Chinese Dominance
As of 2022, China’s total installed capacity stands at 393 GW, nearly double that of the EU’s 205 GW and surpassing the USA’s total of 113 GW by more than threefold in absolute terms.
| Installed solar capacity (GW) | China | EU27 | U.S. |
|---|---|---|---|
| 2022 | 393.0 | 205.5 | 113.0 |
| 2021 | 307.0 | 162.7 | 95.4 |
| 2020 | 254.0 | 136.9 | 76.4 |
| 2019 | 205.0 | 120.1 | 61.6 |
| 2018 | 175.3 | 104.0 | 52.0 |
| 2017 | 130.8 | 96.2 | 43.8 |
| 2016 | 77.8 | 91.5 | 35.4 |
| 2015 | 43.6 | 87.7 | 24.2 |
| 2014 | 28.4 | 83.6 | 18.1 |
| 2013 | 17.8 | 79.7 | 13.3 |
| 2012 | 6.7 | 71.1 | 8.6 |
| 2011 | 3.1 | 53.3 | 5.6 |
| 2010 | 1.0 | 30.6 | 3.4 |
Since 2017, China has shown a compound annual growth rate (CAGR) of approximately 25% in installed PV capacity, while the USA has seen a CAGR of 21%, and the EU of 16%.
Additionally, China dominates the production of solar power components, currently controlling around 80% of the world’s solar panel supply chain.
In 2022, China’s solar industry employed 2.76 million individuals, with manufacturing roles representing approximately 1.8 million and the remaining 918,000 jobs in construction, installation, and operations and maintenance.
The EU industry employed 648,000 individuals, while the U.S. reached 264,000 jobs.
According to the IEA, China accounts for almost 60% of new renewable capacity expected to become operational globally by 2028.
Despite the phasing out of national subsidies in 2020 and 2021, deployment of solar PV in China is accelerating. The country is expected to reach its national 2030 target for wind and solar PV installations in 2024, six years ahead of schedule.

-

 Electrification3 years ago
Ranked: The Top 10 EV Battery Manufacturers
-

 Electrification2 years ago
The Key Minerals in an EV Battery
-

 Real Assets3 years ago
The World’s Top 10 Gold Mining Companies
-

 Electrification3 years ago
Mapped: Solar Power by Country in 2021
-

 Misc3 years ago
All the Metals We Mined in One Visualization
-

 Energy Shift2 years ago
What Are the Five Major Types of Renewable Energy?
-

 Electrification2 years ago
The World’s Largest Nickel Mining Companies
-

 Misc3 years ago
The Largest Copper Mines in the World by Capacity