
This table shows the fluctuating returns for various commodities over the past decade, from energy fuels to industrial and precious metals.
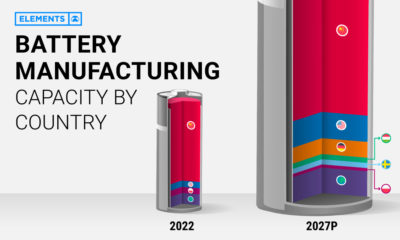

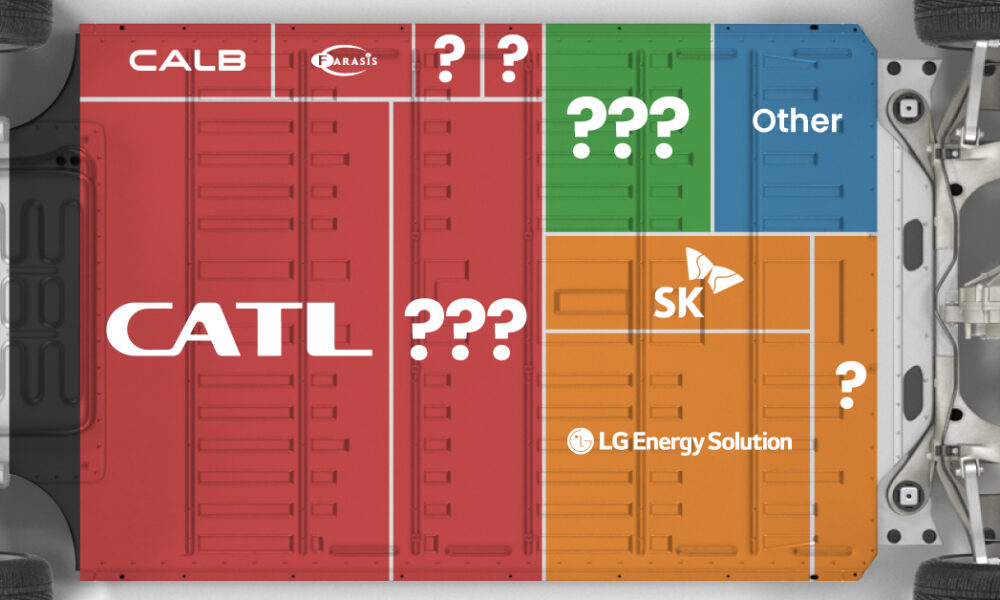
This infographic breaks down battery manufacturing capacity by country in 2022 and 2027.
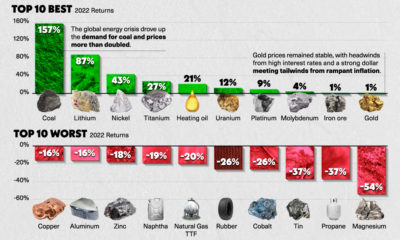

The year 2022 was full of volatility for commodity prices. This infographic charts the top 10 best and worst commodities by returns in 2022.
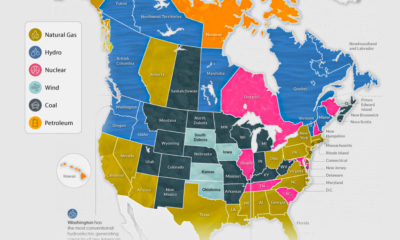

The U.S. and Canada rely on a different makeup of sources to generate their electricity. How does each state and province make theirs?
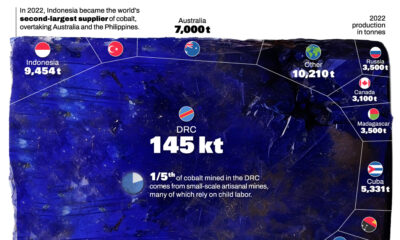

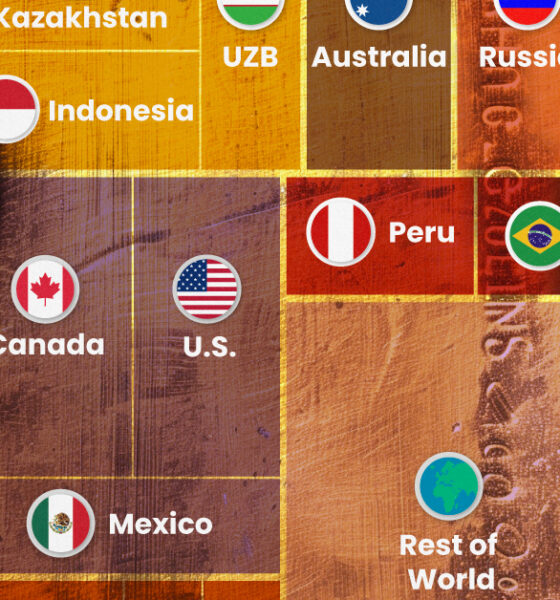
Cobalt, an essential component for certain types of EV batteries, has seen a significant shift in its global production landscape.
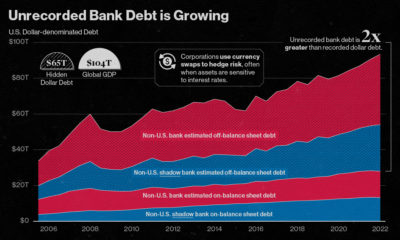

Since 2008, the value of unrecorded dollar debt has doubled. Here's why this is increasing risk in global financial markets.
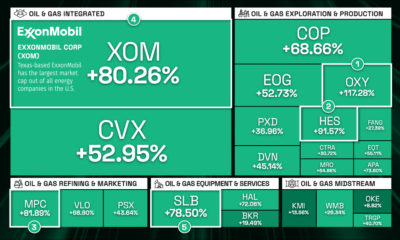

The energy sector outperformed the broader U.S. market in 2022 for the second straight year. Which companies came out on top?
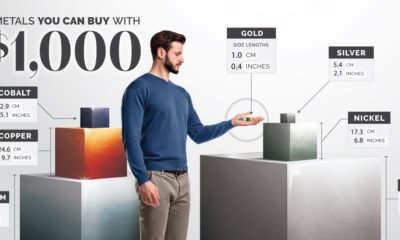

Curious how much of a metal you get for $1,000? This infographic compares the amount of precious and industrial metals worth $1,000.
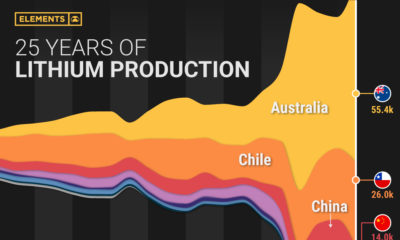

Lithium production has grown exponentially over the last few decades. Which countries produce the most lithium, and how has this mix evolved?
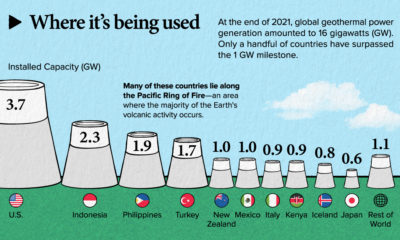

This infographic teaches you everything you need to know about geothermal energy in less than 5 minutes.