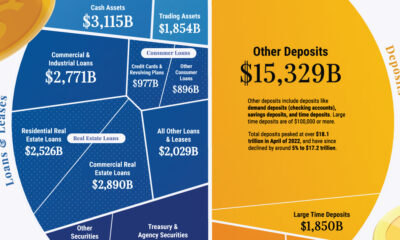

Banks play a crucial role in the U.S. economy, and understanding their balance sheets can offer insight into why they sometimes fail.
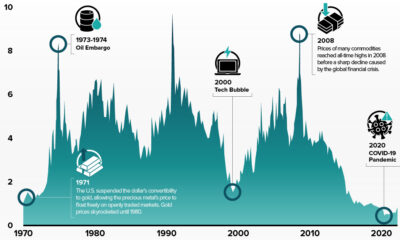

The commodities-to-equities ratio recently hit a 50-year low. In the past, when this ratio reached such levels, commodity supercycles began.
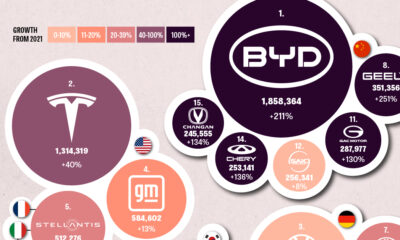

This graphic explores the latest EV production data for 2022, which shows BYD taking a massive step forward to surpass Tesla.
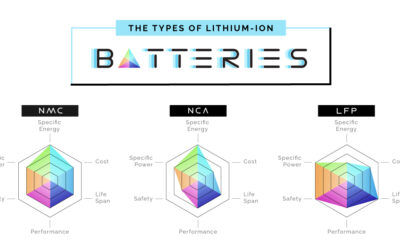

This infographic compares the six major types of lithium-ion batteries in terms of performance, safety, lifespan, and other dimensions.
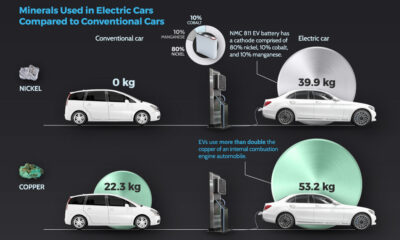

This visualization explores how responsible mining will be essential to meet the demand for copper and nickel.
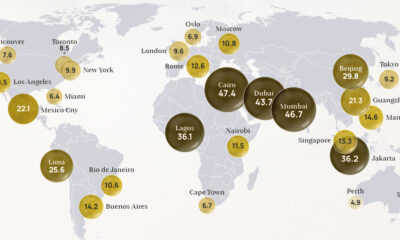

Exploring 2022 average air pollution levels around the world by PM2.5 concentration.
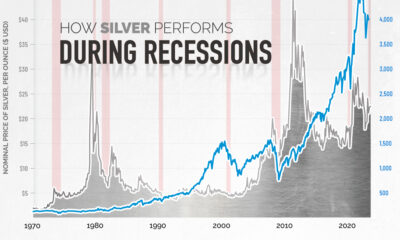

Silver is a unique precious metal that derives demand from scarcity and also industrial applications. So how has it performed during recessions?


Aggregate minerals are a necessary part of maintaining our quality of life, but just how much do we rely on them each year?
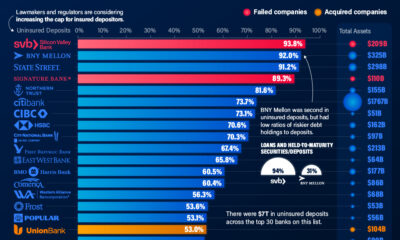

Uninsured deposits in the U.S. total at least $7 trillion. We show the top 30 banks with the highest level of these deposits.
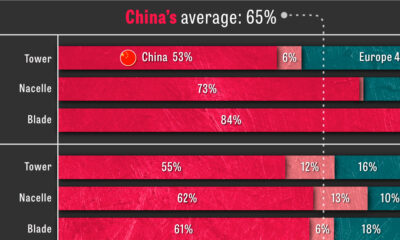

As the market for low-emission solutions expands, China dominates the production of clean energy technologies and their components.