

Misc
Visualizing Raw Steel Production in 2023
![]() See this visualization first on the Voronoi app.
See this visualization first on the Voronoi app.
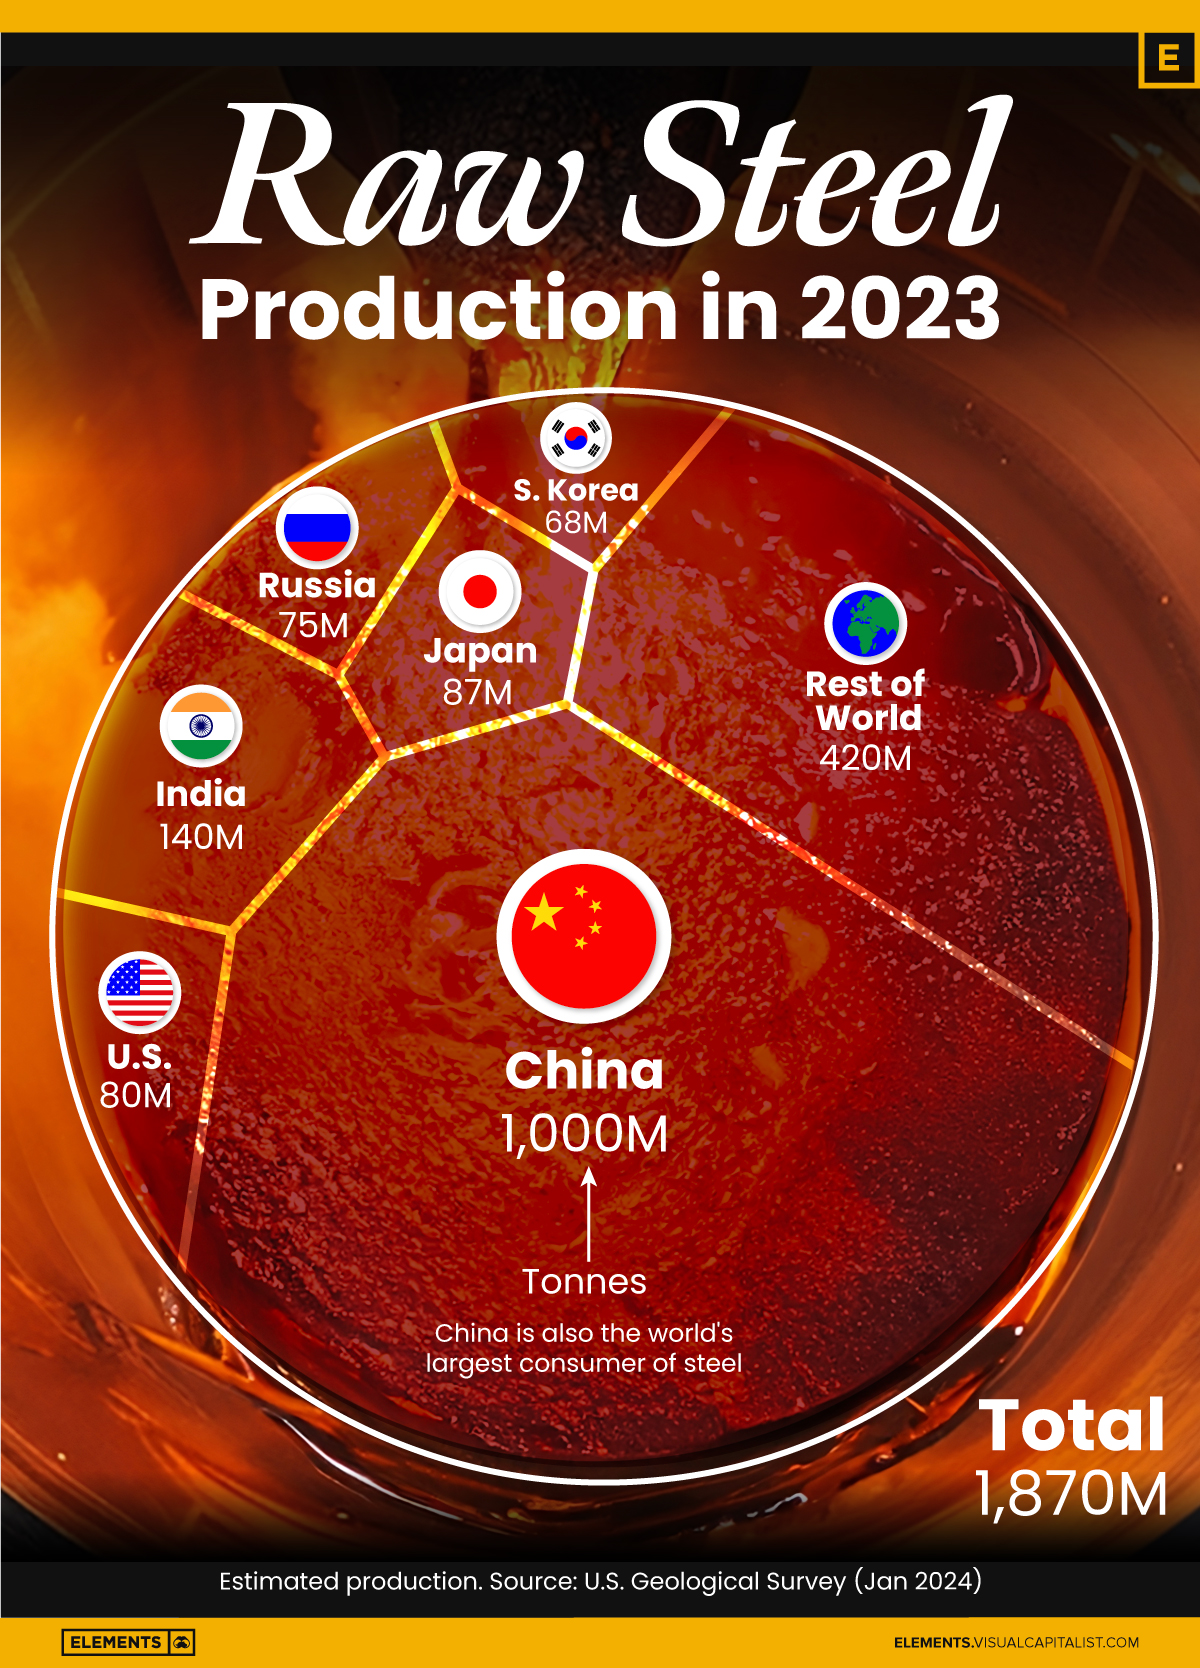
Visualizing Raw Steel Production in 2023
This was originally posted on our Voronoi app. Download the app for free on iOS or Android and discover incredible data-driven charts from a variety of trusted sources.
Steel is essential for the economy due to its crucial role in infrastructure, construction, manufacturing, and transportation sectors.
This graphic breaks down the estimated global production of raw steel in 2023. The data was sourced from the U.S. Geological Survey as of January 2024.
China Produces More Than Half the World’s Steel
One major issue facing the steel industry is overcapacity in top producer China.
Steel production in China has surpassed demand in recent years, leading to downward pressure on the profit margins of steel mills worldwide.
Historically, China’s troubled real estate sector has accounted for over one-third of the country’s steel consumption. To address this issue, the Chinese government has mandated steel production cuts since 2021.
Far behind China, India is the second-biggest producer of steel, followed by Japan.
| Country | Region | 2023 Production (million tonnes) |
|---|---|---|
| 🇨🇳 China | Asia | 1,000 |
| 🇮🇳 India | Asia | 140 |
| 🇯🇵 Japan | Asia | 87 |
| 🇺🇸 U.S. | North America | 80 |
| 🇷🇺 Russia | Europe | 75 |
| 🇰🇷 S. Korea | Asia | 68 |
| 🌍 Rest of World | 420 | |
| Total | 1,870 |
Infinite Recyclability
Steel is an alloy primarily composed of iron ore containing less than 2% carbon, 1% manganese, and other trace elements. It is 1,000 times stronger than iron and can be recycled over and over without sacrificing quality.
Steel is widely used in various industries. It is a fundamental material in construction, providing support through beams, internal structures, and roofing.
Moreover, steel’s corrosion-resistant properties make it ideal for water infrastructure. Stainless steel pipes are the preferred choice for underground water systems, ensuring longevity and purity in water transportation.
Additionally, most canned foods are stored in steel containers for preservation, as steel does not rust.


Misc
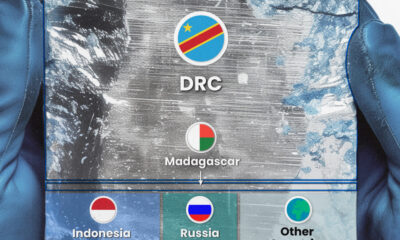
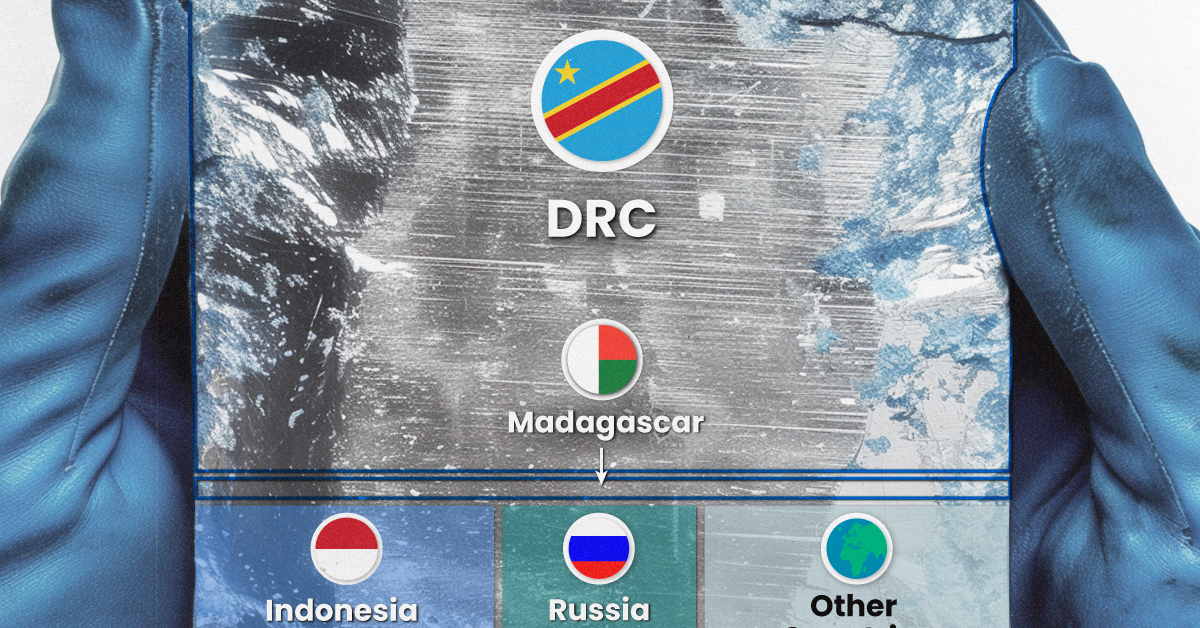
Visualizing Cobalt Production by Country in 2023
The Democratic Republic of Congo accounts for 74% of the world’s cobalt output.
Visualizing Cobalt Production by Country in 2023
This was originally posted on our Voronoi app. Download the app for free on iOS or Android and discover incredible data-driven charts from a variety of trusted sources.
Cobalt is a critical mineral used in numerous commercial, industrial, and military applications. In recent years, it has gained attention as it is also necessary for batteries used in cell phones, laptops, and electric vehicles (EVs).
This graphic illustrates estimated cobalt production by country in 2023 in metric tons. The data is from the most recent U.S. Geological Survey (USGS) Mineral Commodity Summaries, published in January 2024.
The DRC Produces 74% of Global Cobalt
The Democratic Republic of Congo (DRC) accounts for 74% of the world’s cobalt output. Although the metal is found on a large scale in other parts of the world, like Australia, Europe, and Asia, the African nation holds the biggest reserve by far. Of the 11,000,000 metric tons of worldwide reserves, it is estimated that 6,000,000 metric tons are located in the DRC.
| Country | metric tons | Percentage |
|---|---|---|
| 🇨🇩 DRC | 170,000 | 74% |
| 🇮🇩 Indonesia | 17,000 | 7% |
| 🇷🇺 Russia | 8,800 | 4% |
| 🇦🇺 Australia | 4,600 | 2% |
| 🇲🇬 Madagascar | 4,000 | 2% |
| 🇵🇭 Philippines | 3,800 | 2% |
| 🌍 Other Countries | 21,100 | 9.00% |
| Total | 229,300 | 100% |
Since around 20% of the cobalt mined in the DRC originates from small-scale artisanal mines, often employing child labor, the extraction of the metal has been a point of intense debate. With a long history of conflict, political upheaval, and instability, the country is often listed among the poorest nations in the world.
Today, the EV sector constitutes 40% of the overall cobalt market.
China is the world’s leading consumer of cobalt, with nearly 87% of its consumption used by the lithium-ion battery industry.
In the U.S., 50% of cobalt consumed is used in superalloys, mainly in aircraft gas turbine engines.
Learn More About Critical Minerals From Visual Capitalist
If you enjoyed this post, be sure to check out The Critical Minerals to China, EU, and U.S. National Security. This visualization shows which minerals are essential to China, the United States, and the European Union.
Misc
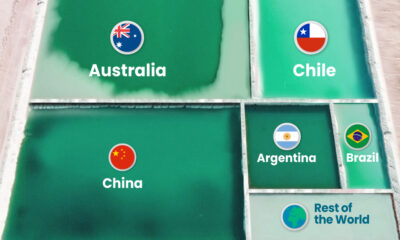
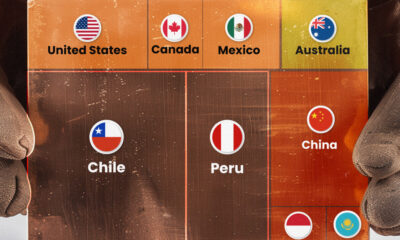
Visualizing Global Aluminum Production
China dominates global production with nearly 60% share.
Visualizing Global Aluminum Production
This was originally posted on our Voronoi app. Download the app for free on iOS or Android and discover incredible data-driven charts from a variety of trusted sources.
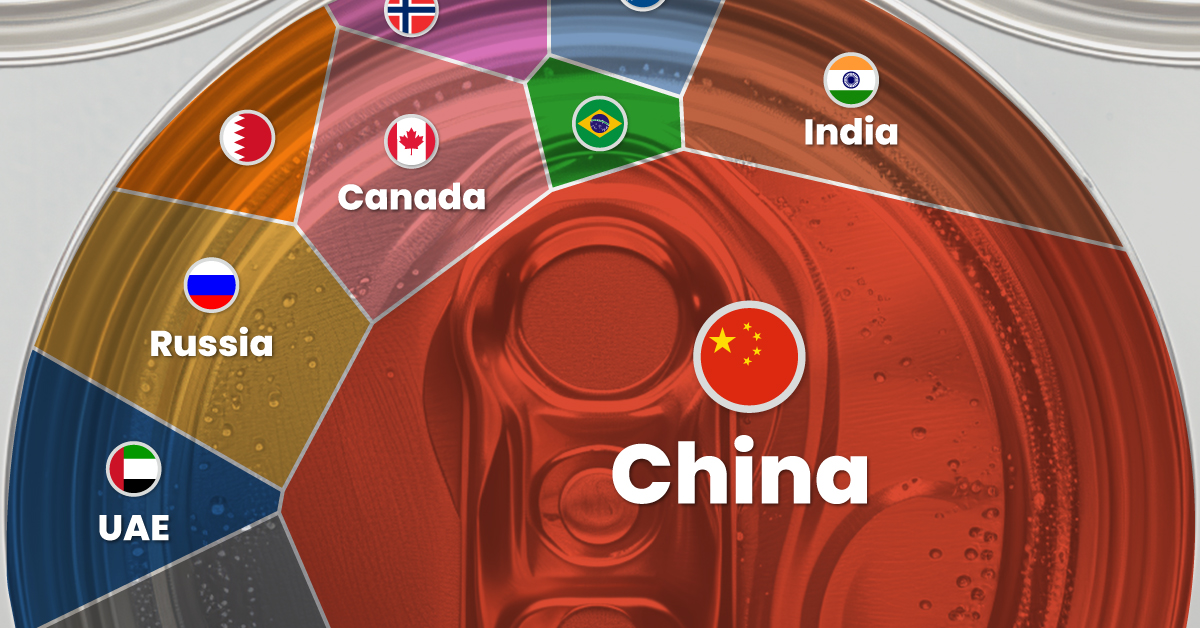
This infographic shows estimated aluminum smelter production by country in 2023, based on data from the most recent U.S. Geological Survey (USGS) Mineral Commodity Summaries, published in January 2024 .
From this data, we can see that China leads as the top producer, accounting for nearly 60% of the world’s smelter capacity. Its neighbor India is the second-largest producer, making only a tenth of China’s output.
| Country | 2023 Aluminum Smelter Production (tonnes) | % of total |
|---|---|---|
| 🇨🇳 China | 41,000,000 | 59% |
| 🇮🇳 India | 4,100,000 | 6% |
| 🇷🇺 Russia | 3,800,000 | 5% |
| 🇨🇦 Canada | 3,000,000 | 4% |
| 🇦🇪 United Arab Emirates | 2,700,000 | 4% |
| 🇧🇭 Bahrain | 1,600,000 | 2% |
| 🇦🇺 Australia | 1,500,000 | 2% |
| 🇳🇴 Norway | 1,300,000 | 2% |
| 🇧🇷 Brazil | 1,100,000 | 2% |
| 🌍 Rest of the World | 9,460,000 | 14% |
| Total | 69,560,000 | 100% |
Responsible for 5% of global aluminum output, Russia has been targeted by recent sanctions from the U.S. and the UK.
The sanctions include prohibiting metal-trading exchanges from accepting new aluminum produced by Russia and barring the import of the Russian metal into the U.S. and Britain. The actions are aimed at disrupting Russian export revenue amid Moscow’s ongoing invasion of Ukraine.
The World’s Most Common Metal
Aluminum is the primary material used for making cans, foil, and many other products. It originates from bauxites, rocks composed of aluminum oxides, and various minerals.
Approximately 25% of annually produced aluminum is utilized by the construction industry, while another 23% is allocated to vehicle frames, wires, wheels, and other components within the transportation sector. Aluminum foil, cans, and packaging constitute another significant end-use category, accounting for 17% of consumption.
Despite its extensive use, aluminum is still plentiful. Aluminum is the world’s most common metal by crustal abundance, making up 8.2% of the Earth’s crust.
According to the USGS, global resources of bauxite are estimated to be between 55 billion and 75 billion tonnes and are sufficient to meet world demand for metal well into the future.

-

 Electrification2 years ago
The Key Minerals in an EV Battery
-

 Real Assets3 years ago
The World’s Top 10 Gold Mining Companies
-

 Electrification3 years ago
Mapped: Solar Power by Country in 2021
-

 Energy Shift2 years ago
What Are the Five Major Types of Renewable Energy?
-

 Electrification3 years ago
The World’s Largest Nickel Mining Companies
-

 Misc3 years ago
The Largest Copper Mines in the World by Capacity
-
 Electrification1 year ago
The Six Major Types of Lithium-ion Batteries: A Visual Comparison
-
 Misc3 years ago
Visualizing the Abundance of Elements in the Earth’s Crust