

Misc
Ranked: The Top 20 Metals and Mining Billionaires
Mining Magnates: The Top 20 Billionaires in Mining
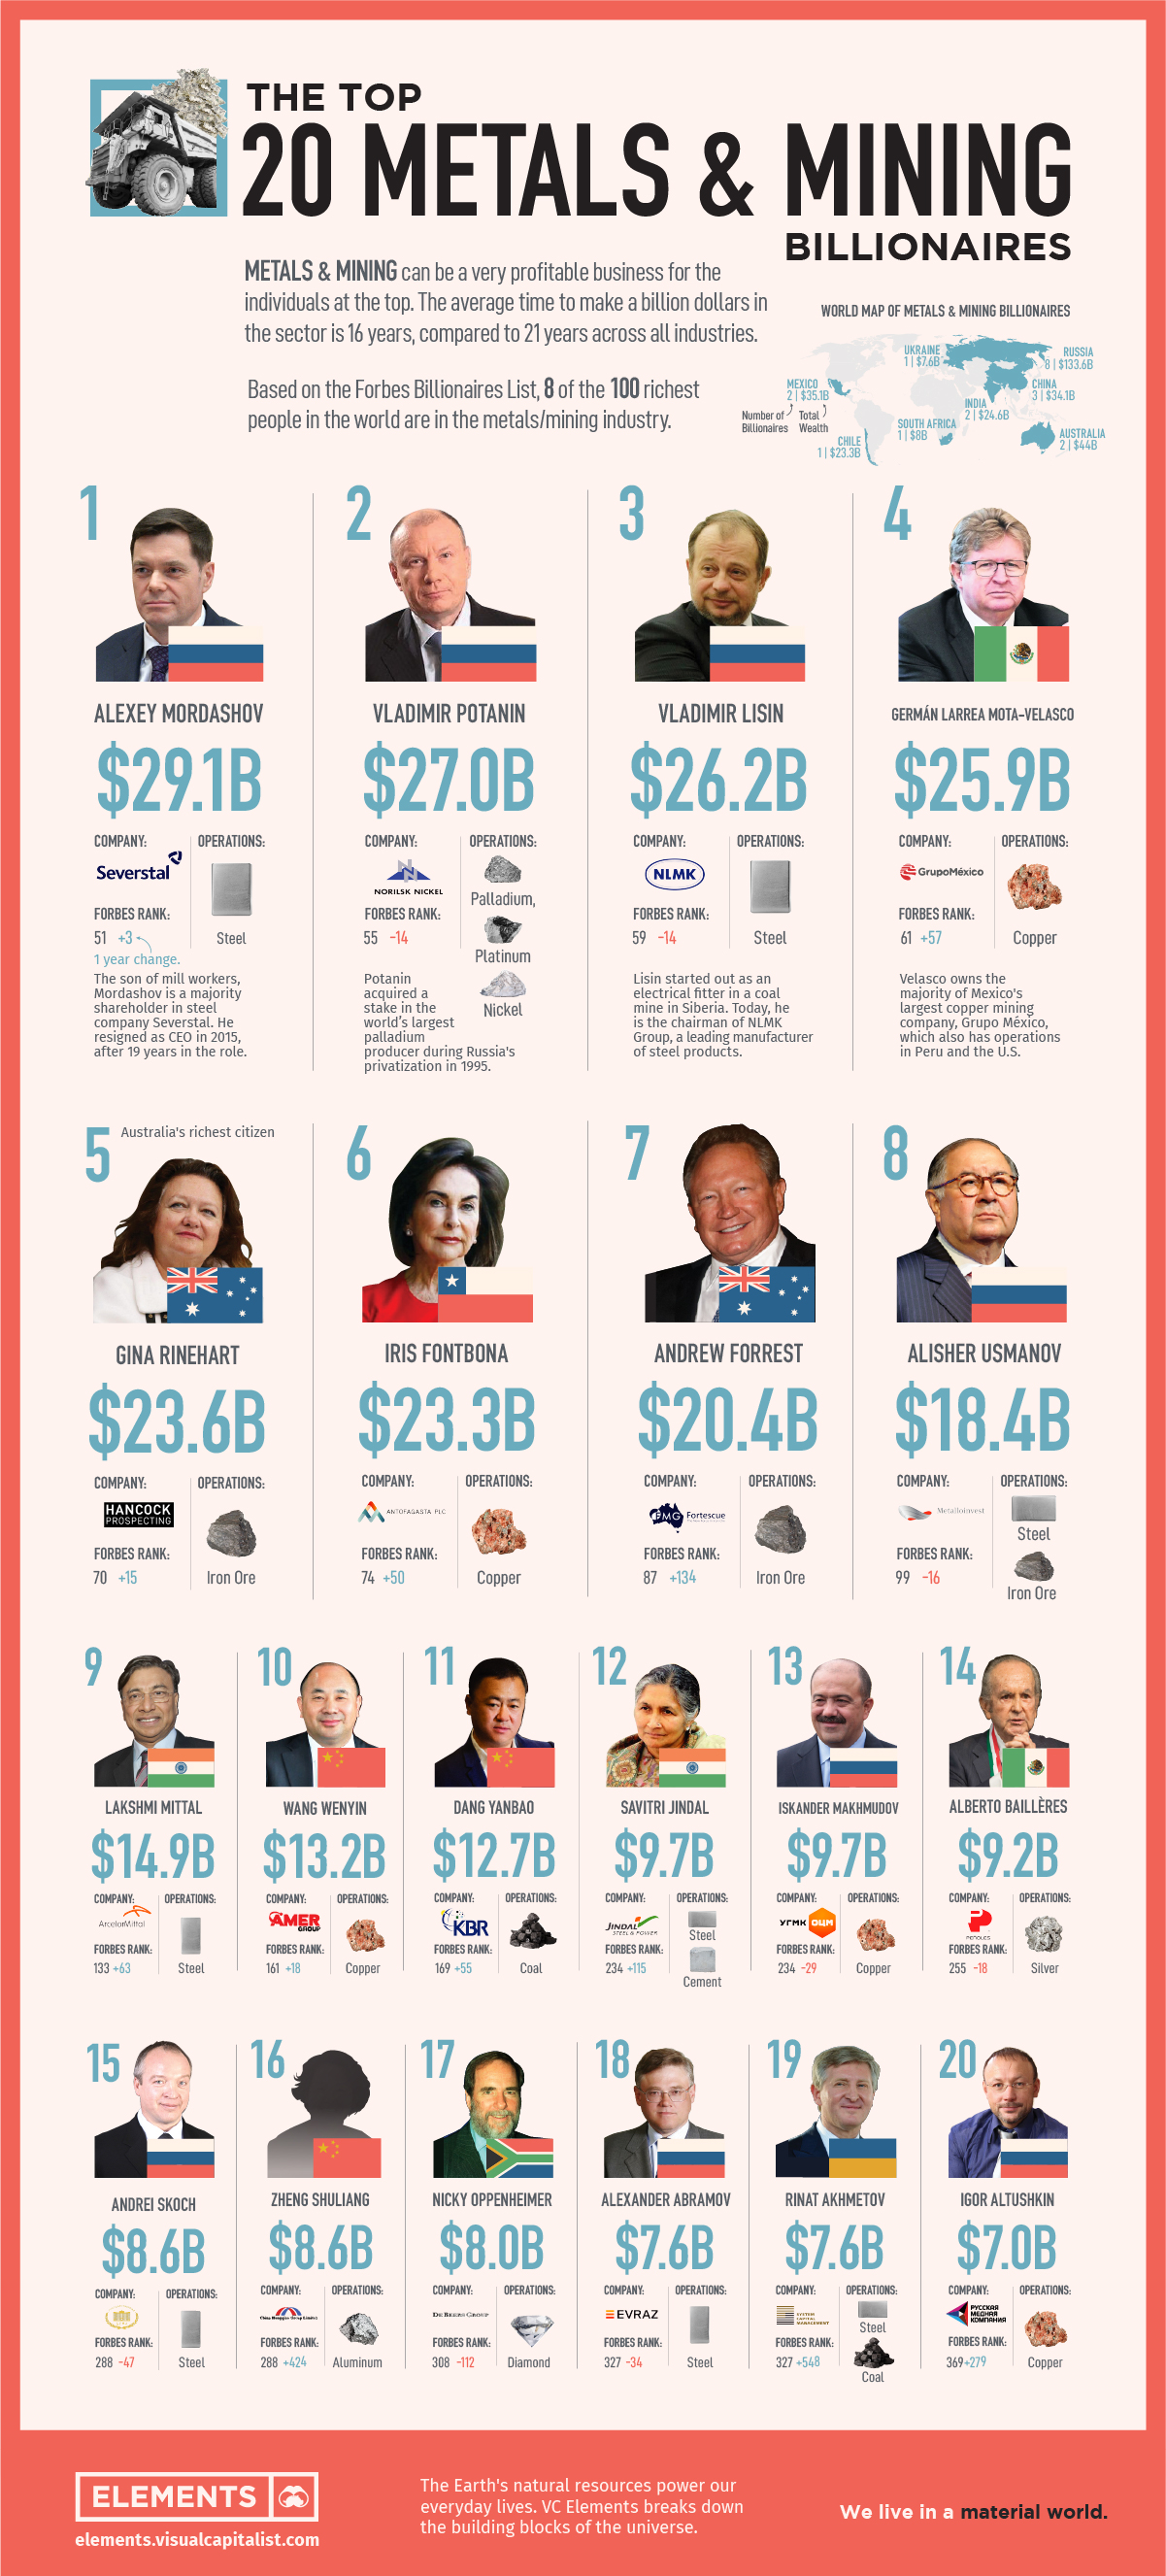
Metals and mining can be a very profitable business for the individuals at the top, but success can also come and go based on volatile commodity prices. The average time to make a billion dollars in the sector is 16 years, compared to 21 years across all industries.
Although tech and bank CEOs get all the limelight, eight of the 100 richest people in the world are in the metals and mining industry. Today’s graphic shows the top 20 metals and mining billionaires, based on the Forbes Billionaires List.
Steel producers dominate the list, followed by copper miners.
| Name | Net Worth | Country | Company | Operations |
|---|---|---|---|---|
| Alexey Mordashov | $29.1B | Russia 🇷🇺 | Severstal | steel |
| Vladimir Potanin | $27.0B | Russia 🇷🇺 | Norilsk Nickel | palladium, platinum, nickel |
| Vladimir Lisin | $26.2B | Russia 🇷🇺 | NLMK Group | steel |
| Germán Larrea Mota-Velasco | $25.9B | Mexico 🇲🇽 | Grupo México | copper |
| Gina Rinehart | $23.6B | Australia 🇦🇺 | Hancock Prospecting | iron ore |
| Iris Fontbona | $23.3B | Chile 🇨🇱 | Antofagasta Plc | copper |
| Andrew Forrest | $20.4B | Australia 🇦🇺 | Fortescue Metals Group | iron ore |
| Alisher Usmanov | $18.4B | Russia 🇷🇺 | Metalloinvest | iron ore/steel |
| Lakshmi Mittal | $14.9B | India 🇮🇳 | ArcelorMittal | steel |
| Wang Wenyin | $13.2B | China 🇨🇳 | Amer International Group | copper |
| Dang Yanbao | $12.7B | China 🇨🇳 | Ningxia Baofeng Energy Group | coal |
| Savitri Jindal | $9.7B | India 🇮🇳 | Jindal Group | steel/cement |
| Iskander Makhmudov | $9.7B | Russia 🇷🇺 | UGMK | copper |
| Alberto Baillères | $9.2B | Mexico 🇲🇽 | Industrias Penoles | silver |
| Andrei Skoch | $8.6B | Russia 🇷🇺 | State Duma | steel |
| Zheng Shuliang | $8.6B | China 🇨🇳 | China Hongqiao Group | aluminum |
| Nicky Oppenheimer | $8.0B | South Africa 🇿🇦 | De Beers | diamond |
| Alexander Abramov | $7.6B | Russia 🇷🇺 | Evraz | steel |
| Rinat Akhmetov | $7.6B | Ukraine 🇺🇦 | System Capital Management | steel, coal |
| Igor Altushkin | $7.6B | Russia 🇷🇺 | Russian Copper Company (RMK) | copper |
Despite being major players in the mining industry, the United States and Canada don’t have representatives on the list.
Russia’s Mining Billionaires
Russia’s huge geographic area is filled with rich mineral resources providing a fertile ground for mining billionaires. It is the largest miner of diamonds and palladium, and the second-largest miner of platinum and nickel. It is no wonder this country hosts eight of the 20 richest people in the industry, including the first few on the list.
Alexey Mordashov, son of steel mill workers that had to use welfare coupons to raise the family, is the first on the list. The 55-year-old businessman is the majority shareholder in steel company Severstal. In the Forbes ranking, which takes into account the assets of the whole family, Mordashov ranks first among all Russian billionaires.
Next on the metals billionaire list is Vladimir Potanin, individually the wealthiest man in Russia and the owner of Norilsk Nickel, the world’s largest producer of palladium and nickel.
Women at the Top
The first woman on the mining billionaires list in the fifth spot, is Australia’s Gina Rinehart, Executive Chairman of Hancock Prospecting. The 67-year-old executive is the only child of legendary explorer Lang Hancock, who discovered the world’s largest iron ore deposit in 1952.
Hancock died in 1992, leaving a bankrupt estate to Gina. She rebuilt and expanded the company over the following decade. As a result, she became a billionaire in 2006 during the iron ore boom.
“If you’re jealous of those with more money, don’t just sit there and complain; do something to make more money yourself”
— Gina Rinehart
The list also includes the wealthiest person in Chile, Iris Fontbona. Iris is the widow of Andrónico Luksic, who built a fortune in the mining, financial, and beverages sectors, including the top copper miner Antofagasta.
A New Era for Mining Fortunes
As demand for most minerals increases due to new technologies and the energy transition, the world needs metals and mining more than ever and soon there will be a new list of billionaires who built their fortune on the minerals of tomorrow.


Misc
Brass Rods: The Secure Choice
This graphic shows why brass rods are the secure choice for precision-machined and forged parts.

Brass Rods: The Secure Choice
The unique combination of machinability and recyclability makes brass rods the secure choice for manufacturers seeking future-proof raw material solutions.
This infographic, from the Copper Development Association, shows three ways brass rods give manufacturers greater control and a license to grow in the competitive market for precision-machined and forged products.
Future-Proof Investments in New Machine Tools
A material’s machinability directly impacts machine throughput, which typically has the largest impact on machine shop profitability.
The high-speed machining capabilities of brass rods maximize machine tool performance, allowing manufacturers to run the material faster and longer without sacrificing tool life, chip formation, or surface quality.
The high machining efficiency of brass leads to reduced per-part costs, quicker return on investment (ROI) for new machine tools, and expanded production capacity for new projects.
Supply Security Through Closed Loop Recycling
Brass, like its parent element copper, can be infinitely recycled.
In 2022, brass- and wire-rod mills accounted for the majority of the 830,000 tonnes of copper recycled from scrap in the U.S.
Given that scrap ratios for machined parts typically range from 60-70% by weight, producing mills benefit from a secure and steady supply of clean scrap returned directly from customers, which is recycled to create new brass rods.
The high residual value of brass scrap creates a strong recycling incentive. Scrap buy back programs give manufacturers greater control over raw material net costs as scrap value is often factored into supplier purchase agreements.
Next Generation Alloys for a Lead-Free Future
Increasingly stringent global regulations continue to pressure manufacturers to minimize the use of materials containing trace amounts of lead and other harmful impurities.
The latest generation of brass-rod alloys is engineered to meet the most demanding criteria for lead leaching in drinking water and other sensitive applications.
Seven brass-rod alloys passed rigorous testing to become the only ‘Acceptable Materials’ against lower lead leaching criteria recently adopted in the national U.S. drinking water quality standard, NSF 61.
Learn more about the advantages of brass rods solutions.
Misc
Brass Rods: The Safe Choice
From airbags to firefighting equipment, components made from brass rods play a vital role in creating a safer environment.

Brass Rods: The Safe Choice
From airbags to firefighting equipment, components made from brass rods play a vital role in creating a safer environment.
This infographic from the Copper Development Association illustrates three use cases for brass. This is the first of three infographics in our Choose Brass series.
Why Brass?
Brass is one of the most reliable metals for industrial and other applications. It contains little to no iron, protecting it from oxidation, which can cause other materials to fail over time.
Additionally, the malleability of brass ensures tight and leak-free metal-to-metal seals for threaded joints, minimizing the risk of costly and dangerous system failures. Brass’s durability ensures critical system components function properly for years.
Brass for Safe Water Systems
Exposure to lead in water can cause various health problems, including neurological damage, developmental delays, and cardiovascular diseases.
As a result, the U.S. sets minimum health-effect requirements for chemical contaminants and impurities indirectly transferred to drinking water from products, components, and materials used in water systems.
Currently, only brass rod alloys are designated as “acceptable materials” according to national standards.
Brass is also essential for ensuring workplace safety, particularly in high-risk manufacturing environments.
Using Brass for Safe Manufacturing and Industrial Environments
Brass is used extensively in industrial applications such as machinery components, valves, fittings, architectural elements, bearings, and gears.
The machinability of brass rods also means longer tool life and higher productivity for manufacturers of precision parts.
The microstructure of brass helps break up metal chips generated during machining operations, preventing long and stringy chips that can crash machines and seriously injure operators.
Additionally, brass’s non-sparking properties make it ideal for tooling, fittings, and components in high-risk industries such as oil & gas, chemicals, pharmaceuticals, paint manufacturing, power plants, and explosives.
Brass for Safer Communities
Many pieces of equipment in our daily lives also rely on brass rod parts to function. Control valves in gas stoves, BBQs, and home furnaces made from brass rods reduce the risk of deadly gas leaks and fires.
Moreover, brass is ideal for firefighting equipment due to its corrosion resistance, durability, heat resistance, and non-sparking properties.
Fittings made from brass rods ensure that the brakes and airbags in our vehicles work when needed.
Brass and other copper-based alloys are also naturally antimicrobial, helping prevent diseases when used in high-touch surfaces such as door handles.
These are only some of the ways that brass rods help build a safer world for everyone.
Explore the Advantages of Brass Rod Solutions.

-

 Electrification3 years ago
Ranked: The Top 10 EV Battery Manufacturers
-

 Electrification2 years ago
The Key Minerals in an EV Battery
-

 Real Assets3 years ago
The World’s Top 10 Gold Mining Companies
-

 Misc3 years ago
All the Metals We Mined in One Visualization
-

 Electrification3 years ago
The Biggest Mining Companies in the World in 2021
-

 Energy Shift2 years ago
What Are the Five Major Types of Renewable Energy?
-

 Electrification2 years ago
Mapped: Solar Power by Country in 2021
-

 Electrification2 years ago
The World’s Largest Nickel Mining Companies