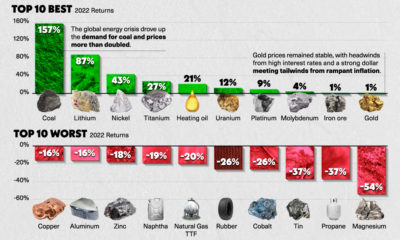

The year 2022 was full of volatility for commodity prices. This infographic charts the top 10 best and worst commodities by returns in 2022.
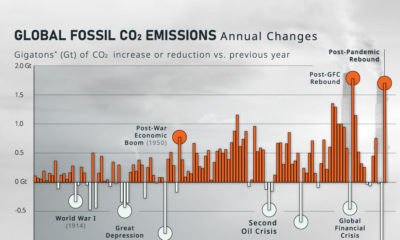

How much do global CO₂ emissions change on a year-to-year basis? Here, we show the annual rate of change in emissions since 1900.
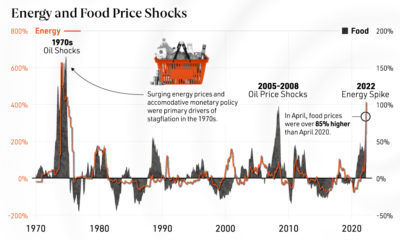

From rising inflation to food insecurity, we show why energy price shocks have far-reaching effects on the global economy.
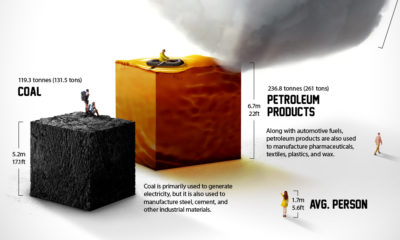

Each year the average American consumes more than 23 barrels of petroleum products. What does a lifetime of fossil fuel consumption look like?
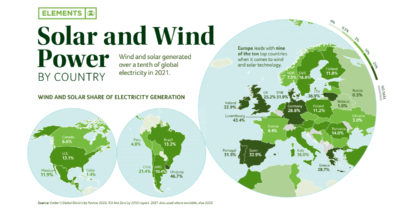

Wind and solar generate over a tenth of the world’s electricity. Taken together, they are the fourth-largest source of electricity, behind coal, gas, and hydro.
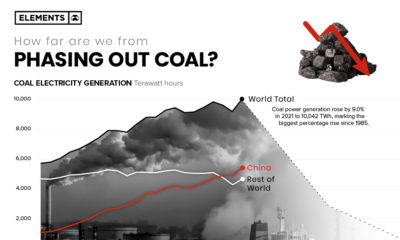

In 2021 coal-fired electricity generation reached all-time highs. Here's the pathway that would be needed to phase it out of the energy mix.
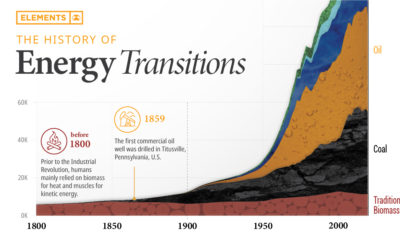

The current energy transition is unprecedented in both scale and speed.
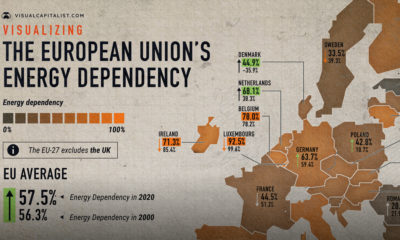

The EU's energy dependency has become a major issue amid Russia's invasion of Ukraine. See what the data says in this infographic.
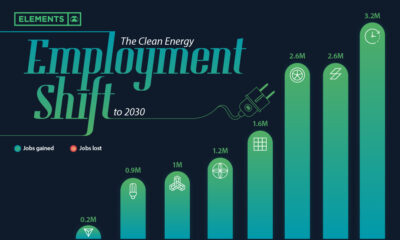

Will the clean energy transition create jobs, or will jobs be lost? Here is projected employment growth in clean energy and related sectors to 2030.
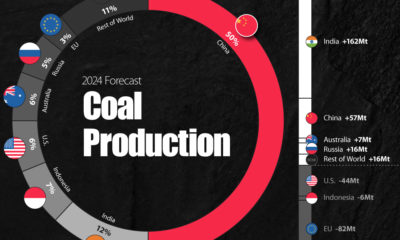

Coal came under scrutiny for its high carbon emissions at COP26, but many countries are forecasted to increase coal production until 2024.


