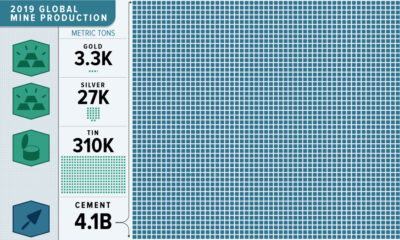

This massive infographic reveals the dramatic scale of 2019 non-fuel mineral global production.
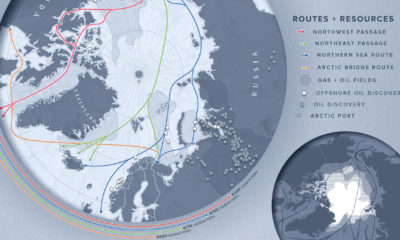

As the Arctic becomes more accessible due to reduced ice cover, countries with polar real estate increasingly viewing the region through an economic lens.
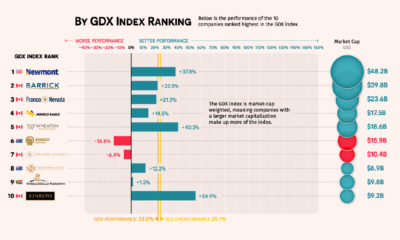

The GDX is an ETF that tracks the performance of the top gold mining stocks. How did the GDX and its constituents perform in 2020?
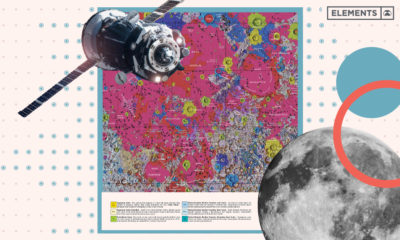

Behold the glory of the Unified Geologic Map of the Moon, which brings decades of data into one map, revealing the potential for exploration.
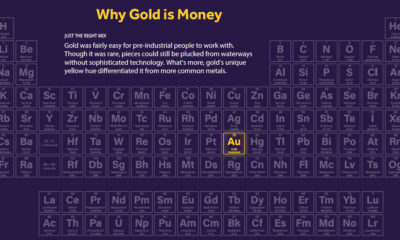

Gold has been used as money for millennia. People often attribute this to beauty, but there are basic physical properties for why gold is money.
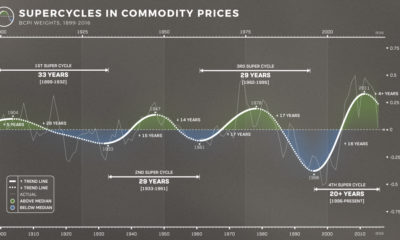

The prices of energy, agriculture, livestock and metals tell the story of human development. Learn about the commodity super cycle in this infographic.
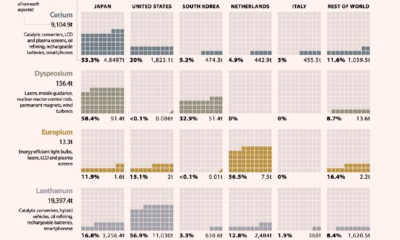

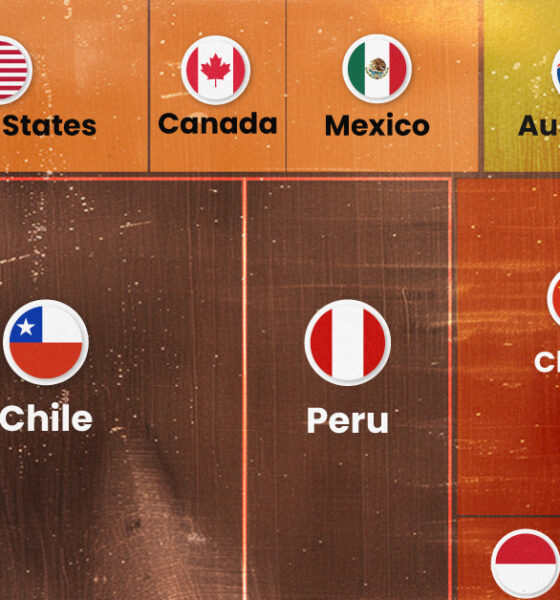
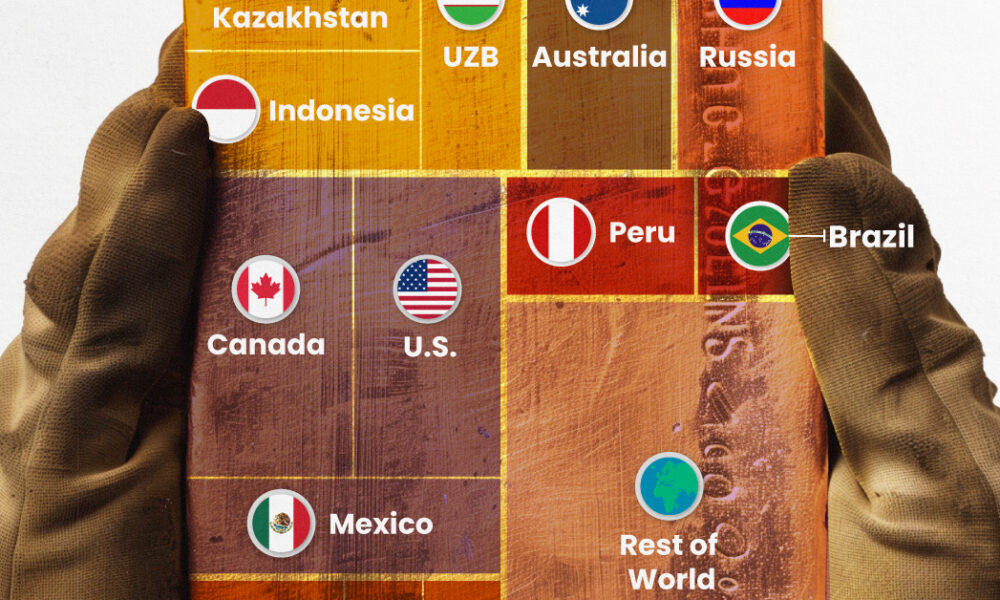
Rare earth deposits exist all over the planet, but the majority of the world's rare earth metals are produced and refined in China.
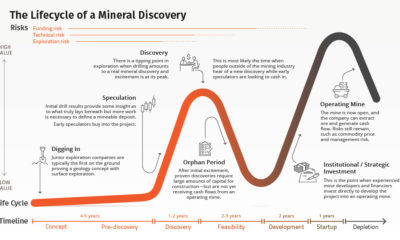

Building a mine takes time that poses risks at every stage. This graphic maps a mineral deposit from discovery to mining, showing where value is created.

There are 91 elements that are defined as metals but not all are the same. Here is a breakdown of the top 10 strongest metals and...
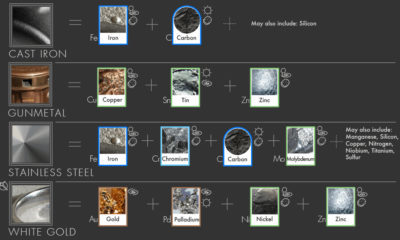

You can't find stainless steel, brass, sterling silver, or white gold on the periodic table. Learn about 20 common metal alloys, and what they are made...