

Real Assets
Prove Your Metal: Top 10 Strongest Metals on Earth
Prove Your Metal: Top 10 Strongest Metals on Earth
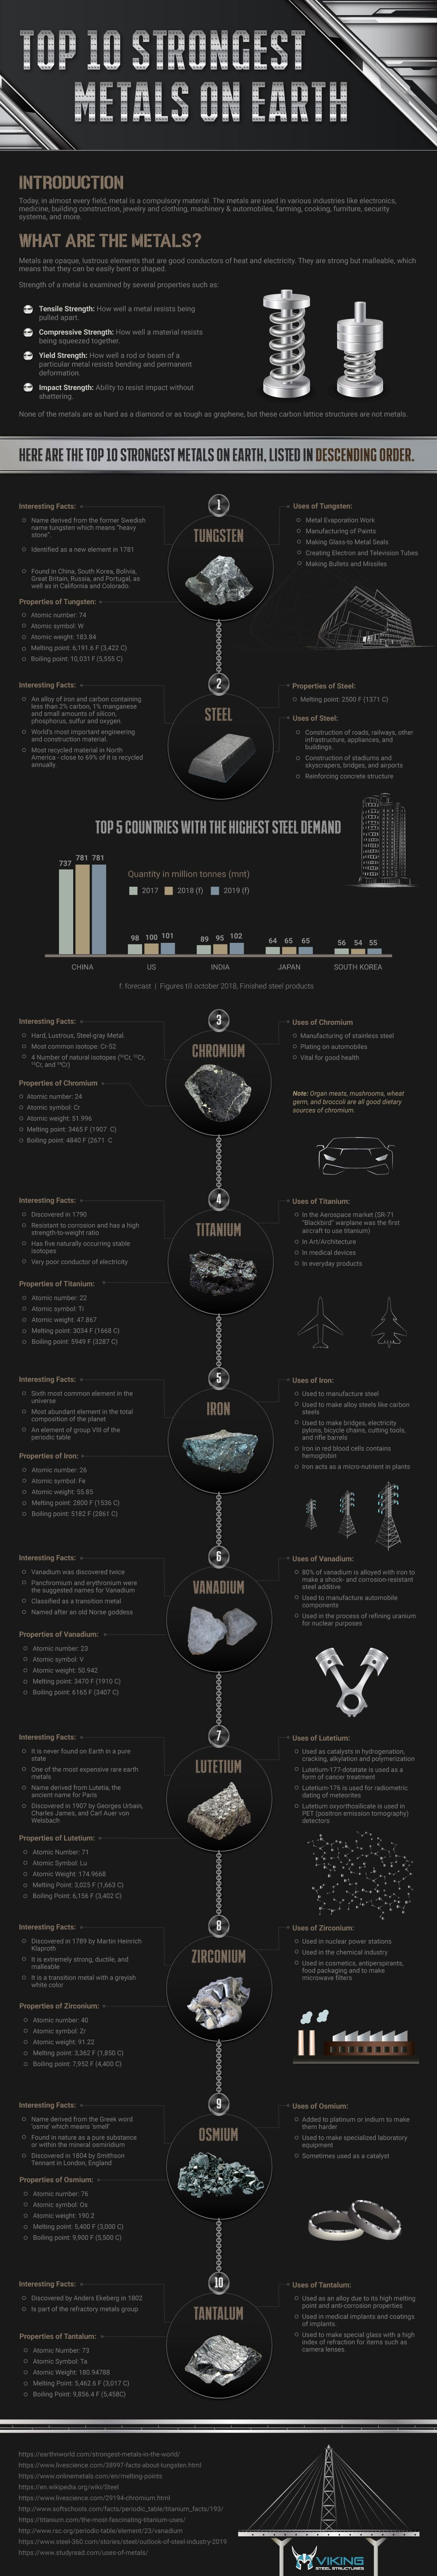
The use of metals and the advancement of human civilization have gone hand in hand — and throughout the ages, each metal has proved its worth based on its properties and applications.
Today’s visualization from Viking Steel Structures outlines the 10 strongest metals on Earth and their applications.
What are Metals?
Metals are solid materials that are typically hard, shiny, malleable, and ductile, with good electrical and thermal conductivity. But not all metal is equal, which makes their uses as varied as their individual properties and benefits.
The periodic table below presents a simple view of the relationship between metals, nonmetals, and metalloids, which you can easily identify by color.
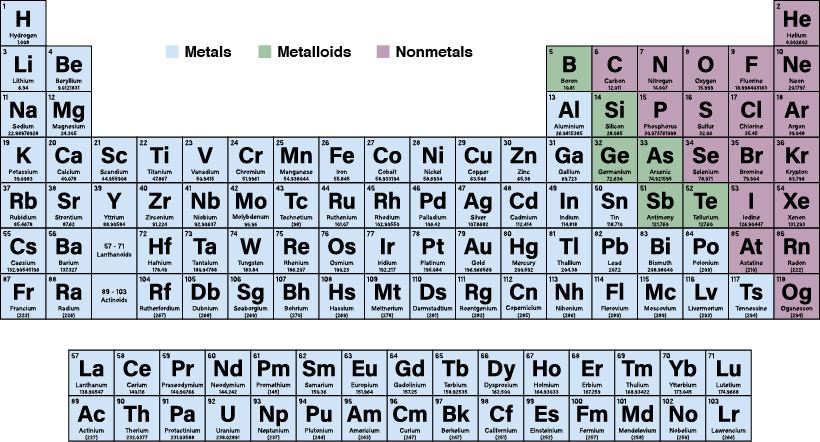
While 91 of the 118 elements of the periodic table are considered to be metals, only a few of them stand out as the strongest.
What Makes a Metal Strong?
The strength of a metal depends on four properties:
- Tensile Strength: How well a metal resists being pulled apart
- Compressive Strength: How well a material resists being squashed together
- Yield Strength: How well a rod or beam of a particular metal resists bending and permanent damage
- Impact Strength: The ability to resist shattering upon impact with another object or surface
Here are the top 10 metals based on these properties.
The Top 10 Strongest Metals
| Rank | Type of Metal | Example Use | Atomic Weight | Melting Point |
|---|---|---|---|---|
| #1 | Tungsten | Making bullets and missiles | 183.84 u | 3422°C / 6192 °F |
| #2 | Steel | Construction of railroads, roads, other infrastructure and appliances | n/a | 1371°C / 2500°F |
| #3 | Chromium | Manufacturing stainless steel | 51.96 u | 1907°C / 3465°F, |
| #4 | Titanium | In the aerospace Industry, as a lightweight material with strength | 47.87 u | 1668°C / 3032°F |
| #5 | Iron | Used to make bridges, electricity, pylons, bicycle chains, cutting tools and rifle barrels | 55.85 u | 1536°C / 2800°F |
| #6 | Vanadium | 80% of vanadium is alloyed with iron to make steel shock and corrosion resistance | 50.942 u | 1910°C / 3470°F |
| #7 | Lutetium | Used as catalysts in petroleum production. | 174.96 u | 1663 °C / 3025°F |
| #8 | Zirconium | Used in nuclear power stations. | 91.22 u | 1850°C / 3.362°F |
| #9 | Osmium | Added to platinum or indium to make them harder. | 190.2 u | 3000°C / 5,400°F |
| #10 | Tantalum | Used as an alloy due to its high melting point and anti-corrosion. | 180.94 u | 3,017°C / 5462°F |
Out of the Forge and into Tech: Metals for the Future
While these metals help to forge the modern world, there is a new class of metals that are set to create a new future.
Rare Earth elements (REEs) are a group of metals do not rely on their strength, but instead their importance in applications in new technologies, including those used for green energy.
| Metal | Uses |
|---|---|
| Neodymium | Magnets containing neodymium are used in green technologies such as the manufacture of wind turbines and hybrid cars. |
| Lanthanum | Used in catalytic converters in cars, enabling them to run at high temperatures |
| Cerium | This element is used in camera and telescope lenses. |
| Praseodymium | Used to create strong metals for use in aircraft engines. |
| Gadolinium | Used in X-ray and MRI scanning systems, and also in television screens. |
| Yttrium, terbium, europium | Making televisions and computer screens and other devices that have visual displays. |
If the world is going to move towards a more sustainable and efficient future, metals—both tough and smart—are going to be critical. Each one will serve a particular purpose to build the infrastructure and technology for the next generation.
Our ability to deploy technology with the right materials will test the world’s mettle to meet the challenges of tomorrow—so choose wisely.


Real Assets
Charted: The Value Gap Between the Gold Price and Gold Miners
While gold prices hit all-time highs, gold mining stocks have lagged far behind.

Gold Price vs. Gold Mining Stocks
This was originally posted on our Voronoi app. Download the app for free on Apple or Android and discover incredible data-driven charts from a variety of trusted sources.
Although the price of gold has reached new record highs in 2024, gold miners are still far from their 2011 peaks.
In this graphic, we illustrate the evolution of gold prices since 2000 compared to the NYSE Arca Gold BUGS Index (HUI), which consists of the largest and most widely held public gold production companies. The data was compiled by Incrementum AG.
Mining Stocks Lag Far Behind
In April 2024, gold reached a new record high as Federal Reserve Chair Jerome Powell signaled policymakers may delay interest rate cuts until clearer signs of declining inflation materialize.
Additionally, with elections occurring in more than 60 countries in 2024 and ongoing conflicts in Ukraine and Gaza, central banks are continuing to buy gold to strengthen their reserves, creating momentum for the metal.
Traditionally known as a hedge against inflation and a safe haven during times of political and economic uncertainty, gold has climbed over 11% so far this year.
According to Business Insider, gold miners experienced their best performance in a year in March 2024. During that month, the gold mining sector outperformed all other U.S. industries, surpassing even the performance of semiconductor stocks.
Still, physical gold has outperformed shares of gold-mining companies over the past three years by one of the largest margins in decades.
| Year | Gold Price | NYSE Arca Gold BUGS Index (HUI) |
|---|---|---|
| 2023 | $2,062.92 | $243.31 |
| 2022 | $1,824.32 | $229.75 |
| 2021 | $1,828.60 | $258.87 |
| 2020 | $1,895.10 | $299.64 |
| 2019 | $1,523.00 | $241.94 |
| 2018 | $1,281.65 | $160.58 |
| 2017 | $1,296.50 | $192.31 |
| 2016 | $1,151.70 | $182.31 |
| 2015 | $1,060.20 | $111.18 |
| 2014 | $1,199.25 | $164.03 |
| 2013 | $1,201.50 | $197.70 |
| 2012 | $1,664.00 | $444.22 |
| 2011 | $1,574.50 | $498.73 |
| 2010 | $1,410.25 | $573.32 |
| 2009 | $1,104.00 | $429.91 |
| 2008 | $865.00 | $302.41 |
| 2007 | $836.50 | $409.37 |
| 2006 | $635.70 | $338.24 |
| 2005 | $513.00 | $276.90 |
| 2004 | $438.00 | $215.33 |
| 2003 | $417.25 | $242.93 |
| 2002 | $342.75 | $145.12 |
| 2001 | $276.50 | $65.20 |
| 2000 | $272.65 | $40.97 |
Among the largest companies on the NYSE Arca Gold BUGS Index, Colorado-based Newmont has experienced a 24% drop in its share price over the past year. Similarly, Canadian Barrick Gold also saw a decline of 6.5% over the past 12 months.
Real Assets
200 Years of Global Gold Production, by Country
Global gold production has grown exponentially since the 1800s, with 86% of all above-ground gold mined in the last 200 years.


Visualizing Global Gold Production Over 200 Years
Although the practice of gold mining has been around for thousands of years, it’s estimated that roughly 86% of all above-ground gold was extracted in the last 200 years.
With modern mining techniques making large-scale production possible, global gold production has grown exponentially since the 1800s.
The above infographic uses data from Our World in Data to visualize global gold production by country from 1820 to 2022, showing how gold mining has evolved to become increasingly global over time.
A Brief History of Gold Mining
The best-known gold rush in modern history occurred in California in 1848, when James Marshall discovered gold in Sacramento Valley. As word spread, thousands of migrants flocked to California in search of gold, and by 1855, miners had extracted around $2 billion worth of gold.
The United States, Australia, and Russia were (interchangeably) the three largest gold producers until the 1890s. Then, South Africa took the helm thanks to the massive discovery in the Witwatersrand Basin, now regarded today as one of the world’s greatest ever goldfields.
South Africa’s annual gold production peaked in 1970 at 1,002 tonnes—by far the largest amount of gold produced by any country in a year.
With the price of gold rising since the 1980s, global gold production has become increasingly widespread. By 2007, China was the world’s largest gold-producing nation, and today a significant quantity of gold is being mined in over 40 countries.
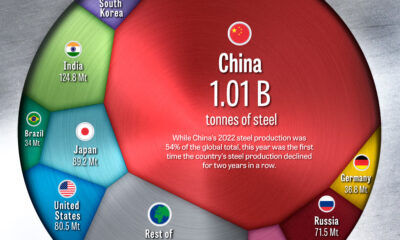
The Top Gold-Producing Countries in 2022
Around 31% of the world’s gold production in 2022 came from three countries—China, Russia, and Australia, with each producing over 300 tonnes of the precious metal.
| Rank | Country | 2022E Gold Production, tonnes | % of Total |
|---|---|---|---|
| #1 | 🇨🇳 China | 330 | 11% |
| #2 | 🇷🇺 Russia | 320 | 10% |
| #3 | 🇦🇺 Australia | 320 | 10% |
| #4 | 🇨🇦 Canada | 220 | 7% |
| #5 | 🇺🇸 United States | 170 | 5% |
| #6 | 🇲🇽 Mexico | 120 | 4% |
| #7 | 🇰🇿 Kazakhstan | 120 | 4% |
| #8 | 🇿🇦 South Africa | 110 | 4% |
| #9 | 🇵🇪 Peru | 100 | 3% |
| #10 | 🇺🇿 Uzbekistan | 100 | 3% |
| #11 | 🇬🇭 Ghana | 90 | 3% |
| #12 | 🇮🇩 Indonesia | 70 | 2% |
| - | 🌍 Rest of the World | 1,030 | 33% |
| - | World Total | 3,100 | 100% |
North American countries Canada, the U.S., and Mexico round out the top six gold producers, collectively making up 16% of the global total. The state of Nevada alone accounted for 72% of U.S. production, hosting the world’s largest gold mining complex (including six mines) owned by Nevada Gold Mines.
Meanwhile, South Africa produced 110 tonnes of gold in 2022, down by 74% relative to its output of 430 tonnes in 2000. This long-term decline is the result of mine closures, maturing assets, and industrial conflict, according to the World Gold Council.
Interestingly, two smaller gold producers on the list, Uzbekistan and Indonesia, host the second and third-largest gold mining operations in the world, respectively.
The Outlook for Global Gold Production
As of April 25, gold prices were hovering around the $2,000 per ounce mark and nearing all-time highs. For mining companies, higher gold prices can mean more profits per ounce if costs remain unaffected.
According to the World Gold Council, mined gold production is expected to increase in 2023 and could surpass the record set in 2018 (3,300 tonnes), led by the expansion of existing projects in North America. The chances of record mine output could be higher if gold prices continue to increase.

-

 Electrification3 years ago
Ranked: The Top 10 EV Battery Manufacturers
-

 Electrification2 years ago
The Key Minerals in an EV Battery
-

 Real Assets3 years ago
The World’s Top 10 Gold Mining Companies
-

 Misc3 years ago
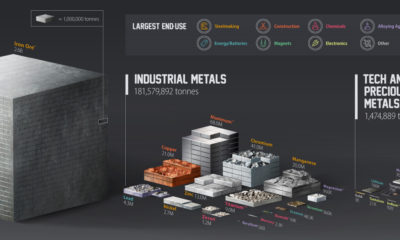
All the Metals We Mined in One Visualization
-

 Electrification3 years ago
The Biggest Mining Companies in the World in 2021
-

 Energy Shift2 years ago
What Are the Five Major Types of Renewable Energy?
-

 Electrification2 years ago
Mapped: Solar Power by Country in 2021
-

 Electrification2 years ago
The World’s Largest Nickel Mining Companies