

Misc
Mapped: The Geology of the Moon in Astronomical Detail
View the full resolution version of this map (47mb)
View the full resolution version of this map (47mb)
Mapped: The Geology of the Moon in Astronomical Detail
If you were to land on the Moon, where would you go?
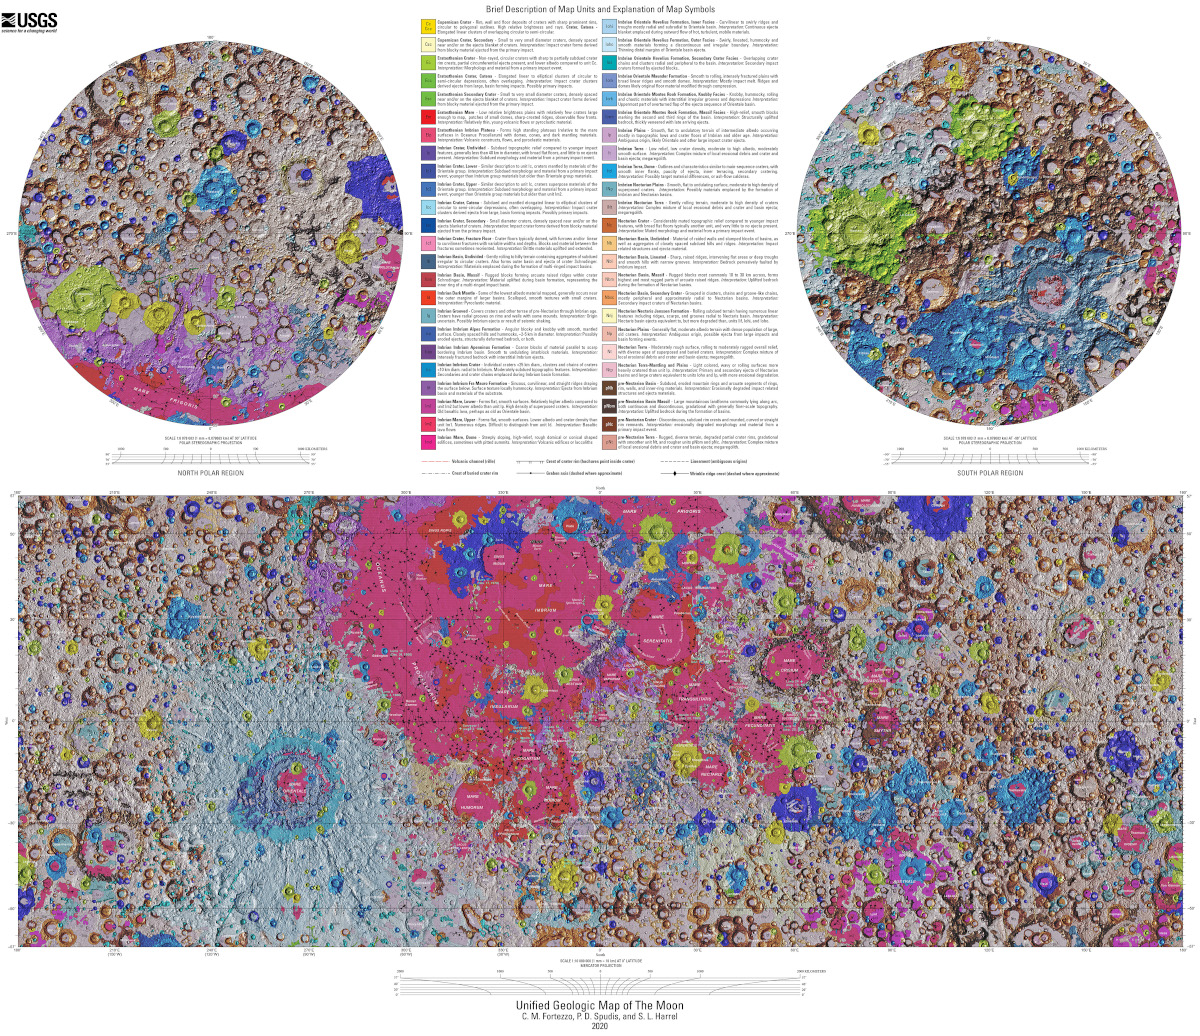
Today’s post is the incredible Unified Geologic Map of the Moon from the USGS, which combines information from six regional lunar maps created during the Apollo era, as well as recent spacecraft observations.
Feet on the Ground, Head in the Sky
Since the beginning of humankind, the Moon has captured our collective imagination. It is one of the few celestial bodies visible to the naked eye from Earth. Over time different cultures wrapped the Moon in their own myths. To the Egyptians it was the god Thoth, to the Greeks, the goddess Artemis, and to the Hindus, Chandra.
Thoth was portrayed as a wise counselor who solved disputes and invented writing and the 365-day calendar. A headdress with a lunar disk sitting atop a crescent moon denoted Thoth as the arbiter of times and seasons.
Artemis was the twin sister of the sun god Apollo, and in Greek mythology she presided over childbirth, fertility, and the hunt. Just like her brother that illuminated the day, she was referred to as the torch bringer during the dark of night.
Chandra means the “Moon” in Sanskrit, Hindi, and other Indian languages. According to one Hindu legend, Ganesha—an elephant-headed deity—was returning home on a full moon night after a feast. On the journey, a snake crossed his pathway, frightening his horse. An overstuffed Ganesha fell to the ground on his stomach, vomiting out his dinner. On observing this, Chandra laughed, causing Ganesha to lose his temper. He broke off one of his tusks and hurled it toward the Moon, cursing him so that he would never be whole again. This legend describes the Moon’s waxing and waning including the big crater on the Moon, visible from Earth.
Such lunar myths have waned as technology has evolved, removing the mystery of the Moon but also opening up scientific debate.
Celestial Evolution: Two Theories
The pot marks on the Moon can be easily seen from the Earth’s surface with the naked eye, and it has led to numerous theories as to the history of the Moon. Recent scientific study brings forward two primary ideas.
One opinion of those who have studied the Moon is that it was once a liquid mass, and that its craters represent widespread and prolonged volcanic activity, when the gases and lava of the heated interior exploded to the surface.
However, there is another explanation for these lunar craters. According to G. K. Gilbert, of the USGS, the Moon was formed by the joining of a ring of meteorites which once encircled the Earth, and after the formation of the lunar sphere, the impact of meteors produced “craters” instead of arising from volcanic activity.
Either way, mapping the current contours of the lunar landscape will guide future human missions to the Moon by revealing regions that may be rich in useful resources or areas that need more detailed mapping to land a spacecraft safely .
Lay of the Land: Reading the Contours of the Moon
This map is a 1:5,000,000-scale geologic map built from six separate digital maps. The goal was to create a resource for science research and analysis to support future geologic mapping efforts.
Mapping purposes divide the Moon into the near side and far side. The far side of the Moon is the side that always faces away from the Earth, while the near side faces towards the Earth.
The most visible topographic feature is the giant far side South Pole-Aitken basin, which possesses the lowest elevations of the Moon. The highest elevations are found just to the northeast of this basin. Other large impact basins, such as the Maria Imbrium, Serenitatis, Crisium, Smythii, and Orientale, also have low elevations and elevated rims.
The colors on the map help to define regional features while also highlighting consistent patterns across the lunar surface. Each one of these regions hosts the potential for resources.
Lunar Resources
Only further study will resolve the evolution of the Moon, but it is clear that there are resources earthlings can exploit. Hydrogen, oxygen, silicon, iron, magnesium, calcium, aluminum, manganese, and titanium are some of the metals and minerals on the Moon.
Interestingly, oxygen is the most abundant element on the Moon. It’s a primary component found in rocks, and this oxygen can be converted to a breathable gas with current technology. A more practical question would be how to best power this process.
Lunar soil is the easiest to mine, it can provide protection from radiation and meteoroids as material for construction. Ice can provide water for radiation shielding, life support, oxygen, and rocket propellant feed stock. Compounds from permanently shadowed craters could provide methane, ammonia, carbon dioxide, and carbon monoxide.
This is just the beginning—as more missions are sent to the Moon, there is more to discover.
Space Faring Humans
NASA plans to land astronauts—one female, one male—to the Moon by 2024 as part of the Artemis 3 mission, and after that, about once each year. It’s the beginning of an unfulfilled promise to make humans a space-faring civilization.
The Moon is just the beginning…the skills learned to map Near-Earth Objects will be the foundation for further exploration and discovery of the universe.


Misc
Brass Rods: The Secure Choice
This graphic shows why brass rods are the secure choice for precision-machined and forged parts.

Brass Rods: The Secure Choice
The unique combination of machinability and recyclability makes brass rods the secure choice for manufacturers seeking future-proof raw material solutions.
This infographic, from the Copper Development Association, shows three ways brass rods give manufacturers greater control and a license to grow in the competitive market for precision-machined and forged products.
Future-Proof Investments in New Machine Tools
A material’s machinability directly impacts machine throughput, which typically has the largest impact on machine shop profitability.
The high-speed machining capabilities of brass rods maximize machine tool performance, allowing manufacturers to run the material faster and longer without sacrificing tool life, chip formation, or surface quality.
The high machining efficiency of brass leads to reduced per-part costs, quicker return on investment (ROI) for new machine tools, and expanded production capacity for new projects.
Supply Security Through Closed Loop Recycling
Brass, like its parent element copper, can be infinitely recycled.
In 2022, brass- and wire-rod mills accounted for the majority of the 830,000 tonnes of copper recycled from scrap in the U.S.
Given that scrap ratios for machined parts typically range from 60-70% by weight, producing mills benefit from a secure and steady supply of clean scrap returned directly from customers, which is recycled to create new brass rods.
The high residual value of brass scrap creates a strong recycling incentive. Scrap buy back programs give manufacturers greater control over raw material net costs as scrap value is often factored into supplier purchase agreements.
Next Generation Alloys for a Lead-Free Future
Increasingly stringent global regulations continue to pressure manufacturers to minimize the use of materials containing trace amounts of lead and other harmful impurities.
The latest generation of brass-rod alloys is engineered to meet the most demanding criteria for lead leaching in drinking water and other sensitive applications.
Seven brass-rod alloys passed rigorous testing to become the only ‘Acceptable Materials’ against lower lead leaching criteria recently adopted in the national U.S. drinking water quality standard, NSF 61.
Learn more about the advantages of brass rods solutions.
Misc
Brass Rods: The Safe Choice
From airbags to firefighting equipment, components made from brass rods play a vital role in creating a safer environment.

Brass Rods: The Safe Choice
From airbags to firefighting equipment, components made from brass rods play a vital role in creating a safer environment.
This infographic from the Copper Development Association illustrates three use cases for brass. This is the first of three infographics in our Choose Brass series.
Why Brass?
Brass is one of the most reliable metals for industrial and other applications. It contains little to no iron, protecting it from oxidation, which can cause other materials to fail over time.
Additionally, the malleability of brass ensures tight and leak-free metal-to-metal seals for threaded joints, minimizing the risk of costly and dangerous system failures. Brass’s durability ensures critical system components function properly for years.
Brass for Safe Water Systems
Exposure to lead in water can cause various health problems, including neurological damage, developmental delays, and cardiovascular diseases.
As a result, the U.S. sets minimum health-effect requirements for chemical contaminants and impurities indirectly transferred to drinking water from products, components, and materials used in water systems.
Currently, only brass rod alloys are designated as “acceptable materials” according to national standards.
Brass is also essential for ensuring workplace safety, particularly in high-risk manufacturing environments.
Using Brass for Safe Manufacturing and Industrial Environments
Brass is used extensively in industrial applications such as machinery components, valves, fittings, architectural elements, bearings, and gears.
The machinability of brass rods also means longer tool life and higher productivity for manufacturers of precision parts.
The microstructure of brass helps break up metal chips generated during machining operations, preventing long and stringy chips that can crash machines and seriously injure operators.
Additionally, brass’s non-sparking properties make it ideal for tooling, fittings, and components in high-risk industries such as oil & gas, chemicals, pharmaceuticals, paint manufacturing, power plants, and explosives.
Brass for Safer Communities
Many pieces of equipment in our daily lives also rely on brass rod parts to function. Control valves in gas stoves, BBQs, and home furnaces made from brass rods reduce the risk of deadly gas leaks and fires.
Moreover, brass is ideal for firefighting equipment due to its corrosion resistance, durability, heat resistance, and non-sparking properties.
Fittings made from brass rods ensure that the brakes and airbags in our vehicles work when needed.
Brass and other copper-based alloys are also naturally antimicrobial, helping prevent diseases when used in high-touch surfaces such as door handles.
These are only some of the ways that brass rods help build a safer world for everyone.
Explore the Advantages of Brass Rod Solutions.

-

 Electrification3 years ago
Ranked: The Top 10 EV Battery Manufacturers
-

 Electrification2 years ago
The Key Minerals in an EV Battery
-

 Real Assets3 years ago
The World’s Top 10 Gold Mining Companies
-

 Misc3 years ago
All the Metals We Mined in One Visualization
-

 Electrification3 years ago
The Biggest Mining Companies in the World in 2021
-

 Energy Shift2 years ago
What Are the Five Major Types of Renewable Energy?
-

 Electrification2 years ago
Mapped: Solar Power by Country in 2021
-

 Electrification2 years ago
The World’s Largest Nickel Mining Companies