

Real Assets
How Much Gold is a Bitcoin Worth?
Visualizing a Bitcoin’s Dollar Value in Gold
Gold has been a store of value in recessions and financial crises, but over the last decade, bitcoin has started to steal its thunder. Sometimes even being dubbed “digital gold”, the cryptocurrency has echoed gold’s epic booms and busts except with much more volatility.
While most people have held gold in the form of jewelry or in various electronic devices, bitcoin remains a physically intangible asset that is stored on digital ledgers and secured with cryptographic keys.
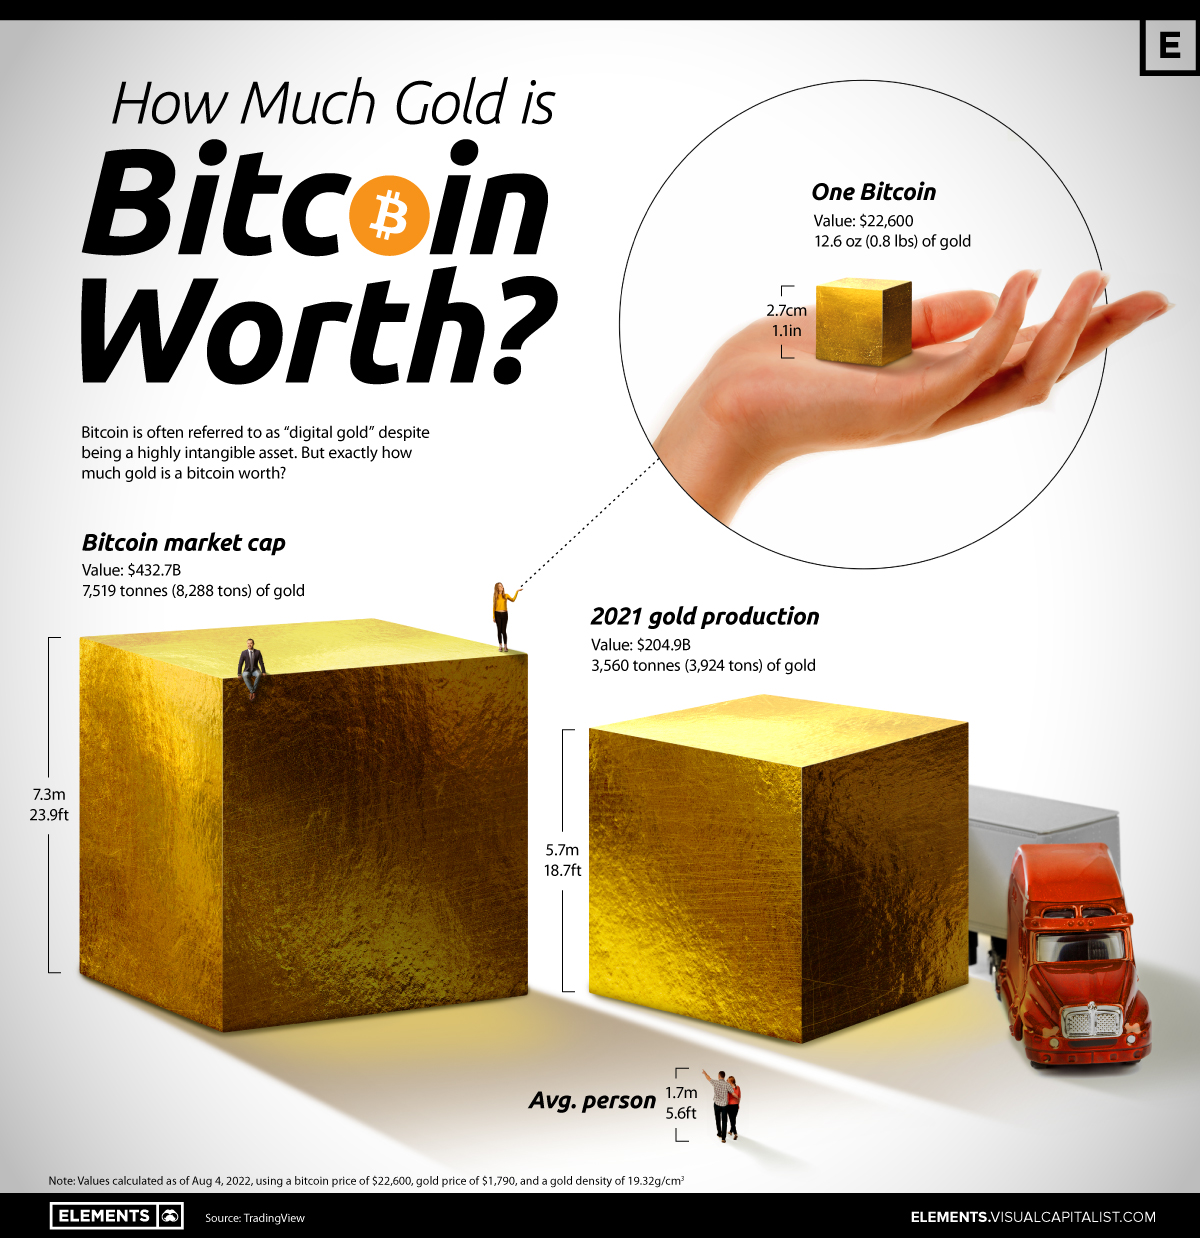
Using price data from TradingView, this graphic compares the two assets by showing how much gold is equivalent to one bitcoin, while also visualizing bitcoin’s market capitalization and 2021 gold production in the form of gold cubes.
What is a Bitcoin’s Weight in Gold?
With a single bitcoin worth around $22,600 at the time of the visualization, this is equivalent to a small cube of gold just over 20 cm3, with each side measuring around 2.7 centimeters, or just over one inch.
This tiny gold cube that fits in the palm of a hand is not only worth $22,600, but also weighs an impressive 12.6 troy ounces (just under 0.8 lbs or around 357 grams) thanks to gold’s extremely high density of 19.32 g/cm3.
When converting the value of bitcoin’s entire market capitalization of $432.7 billion to physical gold, the gold cube would be 7.3 m (23.9 ft), taller than four people stacked on top of each other. To put this in perspective, we also visualized the amount of gold mined in 2021, which was around $204.9 billion worth, weighing in at 3,560.7 tonnes.
Comparing Bitcoin’s Digital Gold to Physical Gold
In its short 13-year lifespan bitcoin has grown tremendously to reach nearly half a trillion in market capitalization currently, but compared to gold it’s still small.
Just 2021’s gold production was worth nearly half of bitcoin’s entire market cap, and with gold’s market cap estimated to be around $11.7 trillion, it’s more than 20 times larger than that of the cryptocurrency’s.
While at first this might seem like a drawback for bitcoin, its small market cap has partially enabled its stratospheric price increases in bull runs.
Due to bitcoin’s smaller market cap, money flowing into bitcoin results in a larger percentage increase than if the same amount of money flowed into gold, giving the cryptocurrency more potential upside but also much more volatility as money moves in and out.
A Tale of Two Stores of Value
While gold has long been a safe haven asset or store of value for investors, in 2021 bitcoin and other cryptocurrencies got all the attention as the orange coin’s price surged by 59% and reached an all-time high of $69,000. However, since the start of 2022, bitcoin’s price has fallen by 49%, and is more than 65% from its all-time high of last year.
As a result of all this volatility, bitcoin is now below any price traded in 2021, meaning anyone who bought bitcoin in 2021 and held on is now down on their investment.
Meanwhile, gold fell by 4% in 2021, and is down another 2% in 2022, so while gold buyers of 2021 are also down on their investment, they’ve had a much smoother ride with smaller losses along the way.
Whatever lies ahead for these two unique assets, in terms of market cap size, returns, and volatility, the digital gold that is bitcoin has a long way to go before it catches up to the real thing.


Real Assets
Visualizing Global Gold Production in 2023
Gold production in 2023 was led by China, Australia, and Russia, with each outputting over 300 tonnes.
Visualizing Global Gold Production in 2023
This was originally posted on our Voronoi app. Download the app for free on iOS or Android and discover incredible data-driven charts from a variety of trusted sources.
Over 3,000 tonnes of gold were produced globally in 2023.
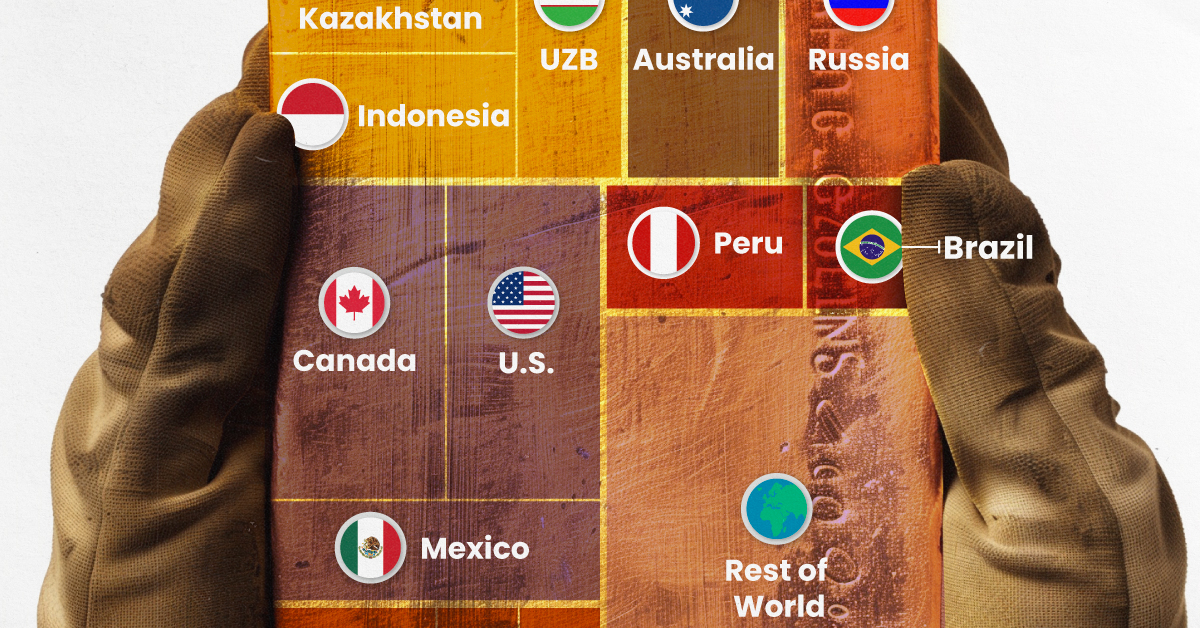
In this graphic, we list the world’s leading countries in terms of gold production. These figures come from the latest USGS publication on gold statistics (published January 2024).
China, Australia, and Russia Produced the Most Gold in 2023
China was the top producer in 2023, responsible for over 12% of total global production, followed by Australia and Russia.
| Country | Region | 2023E Production (tonnes) |
|---|---|---|
| 🇨🇳 China | Asia | 370 |
| 🇦🇺 Australia | Oceania | 310 |
| 🇷🇺 Russia | Europe | 310 |
| 🇨🇦 Canada | North America | 200 |
| 🇺🇸 United States | North America | 170 |
| 🇰🇿 Kazakhstan | Asia | 130 |
| 🇲🇽 Mexico | North America | 120 |
| 🇮🇩 Indonesia | Asia | 110 |
| 🇿🇦 South Africa | Africa | 100 |
| 🇺🇿 Uzbekistan | Asia | 100 |
| 🇬🇭 Ghana | Africa | 90 |
| 🇵🇪 Peru | South America | 90 |
| 🇧🇷 Brazil | South America | 60 |
| 🇧🇫 Burkina Faso | Africa | 60 |
| 🇲🇱 Mali | Africa | 60 |
| 🇹🇿 Tanzania | Africa | 60 |
| 🌍 Rest of World | - | 700 |
Gold mines in China are primarily concentrated in eastern provinces such as Shandong, Henan, Fujian, and Liaoning. As of January 2024, China’s gold mine reserves stand at an estimated 3,000 tonnes, representing around 5% of the global total of 59,000 tonnes.
In addition to being the top producer, China emerged as the largest buyer of the yellow metal for the year. In fact, the country’s central bank alone bought 225 tonnes of gold in 2023, according the World Gold Council.
Estimated Global Gold Consumption
Most of the gold produced in 2023 was used in jewelry production, while another significant portion was sold as a store of value, such as in gold bars or coins.
- Jewelry: 46%
- Central Banks and Institutions: 23%
- Physical Bars: 16%
- Official Coins, Medals, and Imitation Coins: 9%
- Electrical and Electronics: 5%
- Other: 1%
According to Fitch Solutions, over the medium term (2023-2032), global gold mine production is expected to grow 15%, as high prices encourage investment and output.
Real Assets
Charted: The Value Gap Between the Gold Price and Gold Miners
While gold prices hit all-time highs, gold mining stocks have lagged far behind.

Gold Price vs. Gold Mining Stocks
This was originally posted on our Voronoi app. Download the app for free on Apple or Android and discover incredible data-driven charts from a variety of trusted sources.
Although the price of gold has reached new record highs in 2024, gold miners are still far from their 2011 peaks.
In this graphic, we illustrate the evolution of gold prices since 2000 compared to the NYSE Arca Gold BUGS Index (HUI), which consists of the largest and most widely held public gold production companies. The data was compiled by Incrementum AG.
Mining Stocks Lag Far Behind
In April 2024, gold reached a new record high as Federal Reserve Chair Jerome Powell signaled policymakers may delay interest rate cuts until clearer signs of declining inflation materialize.
Additionally, with elections occurring in more than 60 countries in 2024 and ongoing conflicts in Ukraine and Gaza, central banks are continuing to buy gold to strengthen their reserves, creating momentum for the metal.
Traditionally known as a hedge against inflation and a safe haven during times of political and economic uncertainty, gold has climbed over 11% so far this year.
According to Business Insider, gold miners experienced their best performance in a year in March 2024. During that month, the gold mining sector outperformed all other U.S. industries, surpassing even the performance of semiconductor stocks.
Still, physical gold has outperformed shares of gold-mining companies over the past three years by one of the largest margins in decades.
| Year | Gold Price | NYSE Arca Gold BUGS Index (HUI) |
|---|---|---|
| 2023 | $2,062.92 | $243.31 |
| 2022 | $1,824.32 | $229.75 |
| 2021 | $1,828.60 | $258.87 |
| 2020 | $1,895.10 | $299.64 |
| 2019 | $1,523.00 | $241.94 |
| 2018 | $1,281.65 | $160.58 |
| 2017 | $1,296.50 | $192.31 |
| 2016 | $1,151.70 | $182.31 |
| 2015 | $1,060.20 | $111.18 |
| 2014 | $1,199.25 | $164.03 |
| 2013 | $1,201.50 | $197.70 |
| 2012 | $1,664.00 | $444.22 |
| 2011 | $1,574.50 | $498.73 |
| 2010 | $1,410.25 | $573.32 |
| 2009 | $1,104.00 | $429.91 |
| 2008 | $865.00 | $302.41 |
| 2007 | $836.50 | $409.37 |
| 2006 | $635.70 | $338.24 |
| 2005 | $513.00 | $276.90 |
| 2004 | $438.00 | $215.33 |
| 2003 | $417.25 | $242.93 |
| 2002 | $342.75 | $145.12 |
| 2001 | $276.50 | $65.20 |
| 2000 | $272.65 | $40.97 |
Among the largest companies on the NYSE Arca Gold BUGS Index, Colorado-based Newmont has experienced a 24% drop in its share price over the past year. Similarly, Canadian Barrick Gold also saw a decline of 6.5% over the past 12 months.

-

 Electrification3 years ago
Ranked: The Top 10 EV Battery Manufacturers
-

 Electrification2 years ago
The Key Minerals in an EV Battery
-

 Real Assets3 years ago
The World’s Top 10 Gold Mining Companies
-

 Misc3 years ago
All the Metals We Mined in One Visualization
-

 Energy Shift2 years ago
What Are the Five Major Types of Renewable Energy?
-

 Electrification2 years ago
Mapped: Solar Power by Country in 2021
-

 Electrification2 years ago
The World’s Largest Nickel Mining Companies
-

 Misc3 years ago
The Largest Copper Mines in the World by Capacity