

Energy Shift
Which Countries Have the World’s Largest Coal Reserves?
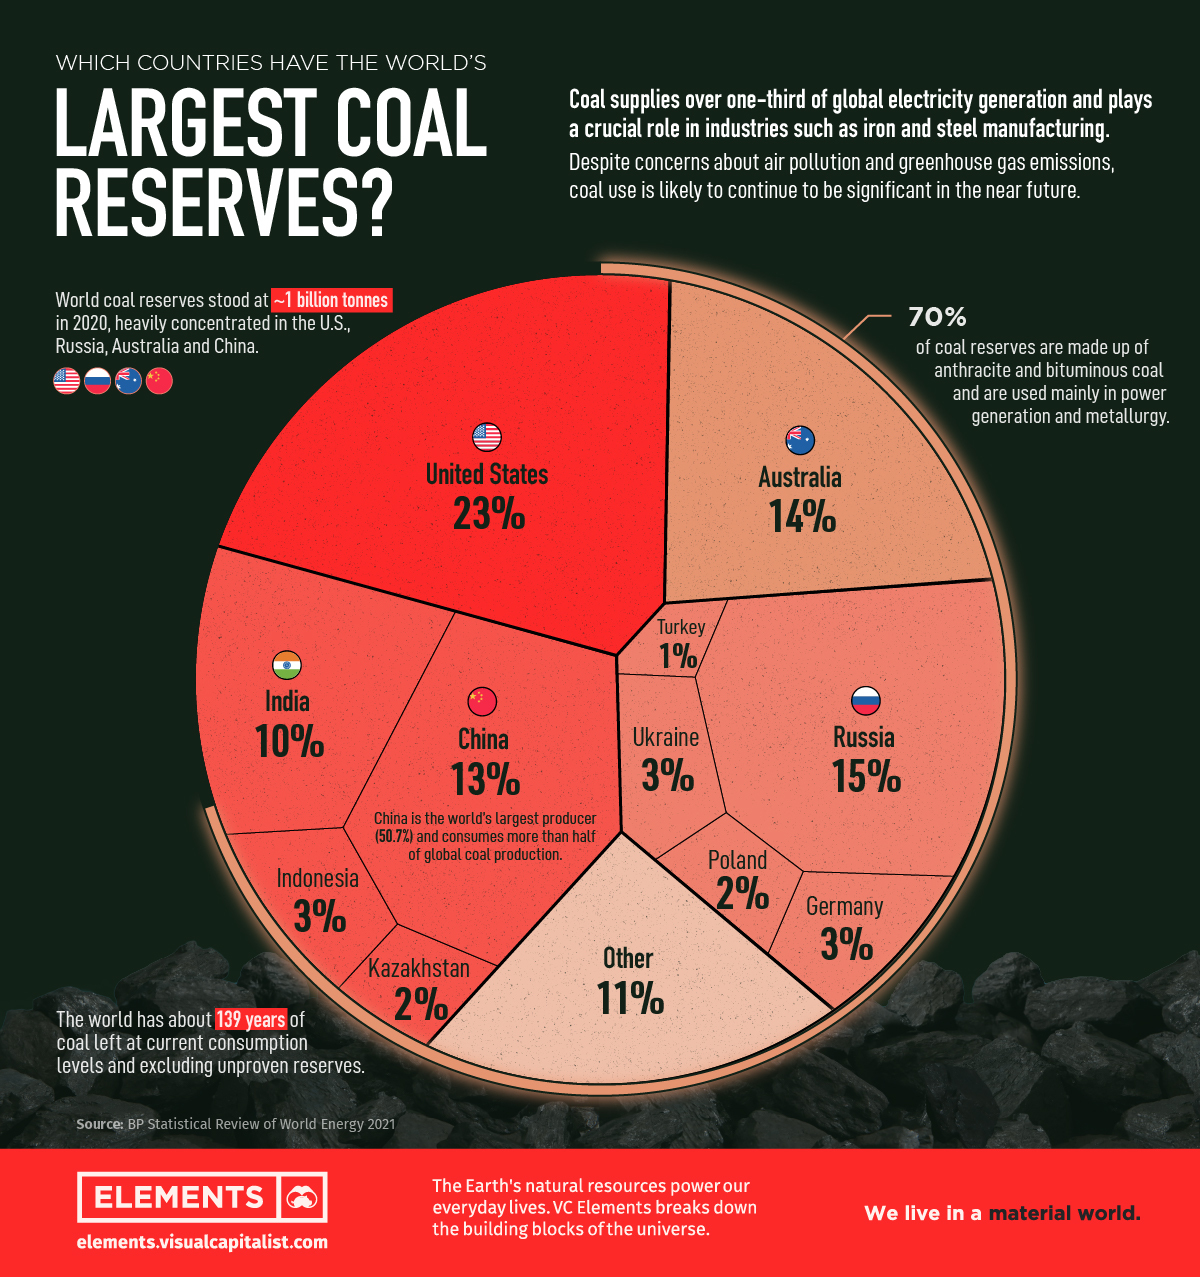
The Countries With the Largest Coal Reserves
Cheap and abundant coal remains one of the largest sources of energy worldwide, even as governments set out goals to reduce greenhouse gas emissions.
While jurisdictions in Europe and North America have been phasing out coal use in power generation, it has been on the rise in Asia. China and India are scrambling to provide electricity to a growing population and relying on coal power plants to meet demands despite the environmental costs.
This infographic takes a look into the BP Statistical Review of World Energy 2021, and the 11 countries that make up 89% of the coal reserves globally.
Coal Reserves, by Country
While countries need to phase out coal by 2040 to achieve the Paris Agreement goal of limiting global warming to 1.5ºC, consumption in key markets is forecast to increase for the next few years and coal-fired electricity generation could hit a record in 2022, according to the International Energy Agency.
China leads the consumption, buying more than half of the global production and also producing 50% of the world’s coal.
Although the country recently announced a plan to have CO2 emissions peak before 2030 and achieve carbon neutrality before 2060, it is still building coal power projects elsewhere in the world, according to the Coal Finance Tracker by EndCoal. Japan and South Korea are also still strongly financing coal extraction in Southeast Asia.
A shortlist of countries in four continents control ~1 billion tonnes of coal:
| Country | Coal Reserves (million tonnes) | Share of Global Reserves | Region |
|---|---|---|---|
| U.S. 🇺🇸 | 248,941 | 23% | North America |
| Russia 🇷🇺 | 162,166 | 15% | Europe |
| Australia 🇦🇺 | 150,227 | 14% | Oceania |
| China 🇨🇳 | 143,197 | 13% | Asia |
| India 🇮🇳 | 111,052 | 10% | Asia |
| Germany 🇩🇪 | 35,900 | 3% | Europe |
| Indonesia 🇮🇩 | 34,869 | 3% | Asia |
| Ukraine 🇺🇦 | 34,375 | 3% | Europe |
| Poland 🇵🇱 | 28,395 | 2% | Europe |
| Kazakhstan 🇰🇿 | 25,605 | 2% | Asia |
| Turkey 🇹🇷 | 11,525 | 1% | Europe |
To put the numbers into perspective, the world has about 139 years of coal left at current consumption levels and excluding unproven reserves.
What are the Different Types of Coal?
Coal is formed when dead plant matter submerged in swamp environments is subjected to heat and pressure over hundreds of millions of years. Over time, the plant matter turns into a carbon-dense black or brownish-black sedimentary rock – coal.
There are four major types or “ranks” of coal, based on the types and amounts of carbon the coal contains and on the amount of heat energy the coal can produce:
- Anthracite: The highest rank, is a hard, brittle, and black lustrous substance. It contains a high percentage of fixed carbon and is mainly used in stoves, furnaces, and water filtration systems. Formation: 300-360 million years old.
- Bituminous: Middle rank, usually has a high heating (Btu) value and is used in electricity generation and steel-making. Formation: 100-300 million years old.
- Sub-bituminous: Black, not shiny, it has low-to-moderate heating values and is mainly used in electricity generation. Formation: 100 million years old.
- Lignite: Also called brown coal, it has the least concentration of carbon, low heating value, and is mainly used in electricity generation. Formation: 250 million years old.
Anthracite and bituminous coal make up 70% of coal reserves. The other 30% are divided between sub-bituminous and lignite.
The Future of Coal
Coal combustion still accounts for 40% of global CO2 emissions from energy use, despite all the efforts to reduce the share of power generated by fossil fuels.
Meanwhile, the coal mining industry employs about 8 million people and creates revenues of more than US$900 billion a year.
While growth in coal investments is slowing, coal use is unlikely to decline substantially in the medium term.


Energy Shift
The World’s Biggest Oil Producers in 2023
Just three countries accounted for 40% of global oil production last year.

The World’s Biggest Oil Producers in 2023
This was originally posted on our Voronoi app. Download the app for free on iOS or Android and discover incredible data-driven charts from a variety of trusted sources.
Despite efforts to decarbonize the global economy, oil still remains one of the world’s most important resources. It’s also produced by a fairly limited group of countries, which can be a source of economic and political leverage.
This graphic illustrates global crude oil production in 2023, measured in million barrels per day, sourced from the U.S. Energy Information Administration (EIA).
Three Countries Account for 40% of Global Oil Production
In 2023, the United States, Russia, and Saudi Arabia collectively contributed 32.7 million barrels per day to global oil production.
| Oil Production 2023 | Million barrels per day |
|---|---|
| 🇺🇸 U.S. | 12.9 |
| 🇷🇺 Russia | 10.1 |
| 🇸🇦 Saudi Arabia | 9.7 |
| 🇨🇦 Canada | 4.6 |
| 🇮🇶 Iraq | 4.3 |
| 🇨🇳 China | 4.2 |
| 🇮🇷 Iran | 3.6 |
| 🇧🇷 Brazil | 3.4 |
| 🇦🇪 UAE | 3.4 |
| 🇰🇼 Kuwait | 2.7 |
| 🌍 Other | 22.8 |
These three nations have consistently dominated oil production since 1971. The leading position, however, has alternated among them over the past five decades.
In contrast, the combined production of the next three largest producers—Canada, Iraq, and China—reached 13.1 million barrels per day in 2023, just surpassing the production of the United States alone.
In the near term, no country is likely to surpass the record production achieved by the U.S. in 2023, as no other producer has ever reached a daily capacity of 13.0 million barrels. Recently, Saudi Arabia’s state-owned Saudi Aramco scrapped plans to increase production capacity to 13.0 million barrels per day by 2027.
In 2024, analysts forecast that the U.S. will maintain its position as the top oil producer. In fact, according to Macquarie Group, U.S. oil production is expected to achieve a record pace of about 14 million barrels per day by the end of the year.
Energy Shift
How Much Does the U.S. Depend on Russian Uranium?
Despite a new uranium ban being discussed in Congress, the U.S. is still heavily dependent on Russian uranium.

How Much Does the U.S. Depend on Russian Uranium?
This was originally posted on our Voronoi app. Download the app for free on iOS or Android and discover incredible data-driven charts from a variety of trusted sources.
The U.S. House of Representatives recently passed a ban on imports of Russian uranium. The bill must pass the Senate before becoming law.
In this graphic, we visualize how much the U.S. relies on Russian uranium, based on data from the United States Energy Information Administration (EIA).
U.S. Suppliers of Enriched Uranium
After Russia invaded Ukraine, the U.S. imposed sanctions on Russian-produced oil and gas—yet Russian-enriched uranium is still being imported.
Currently, Russia is the largest foreign supplier of nuclear power fuel to the United States. In 2022, Russia supplied almost a quarter of the enriched uranium used to fuel America’s fleet of more than 90 commercial reactors.
| Country of enrichment service | SWU* | % |
|---|---|---|
| 🇺🇸 United States | 3,876 | 27.34% |
| 🇷🇺 Russia | 3,409 | 24.04% |
| 🇩🇪 Germany | 1,763 | 12.40% |
| 🇬🇧 United Kingdom | 1,593 | 11.23% |
| 🇳🇱 Netherlands | 1,303 | 9.20% |
| Other | 2,232 | 15.79% |
| Total | 14,176 | 100% |
SWU stands for “Separative Work Unit” in the uranium industry. It is a measure of the amount of work required to separate isotopes of uranium during the enrichment process. Source: U.S. Energy Information Administration
Most of the remaining uranium is imported from European countries, while another portion is produced by a British-Dutch-German consortium operating in the United States called Urenco.
Similarly, nearly a dozen countries around the world depend on Russia for more than half of their enriched uranium—and many of them are NATO-allied members and allies of Ukraine.
In 2023 alone, the U.S. nuclear industry paid over $800 million to Russia’s state-owned nuclear energy corporation, Rosatom, and its fuel subsidiaries.
It is important to note that 19% of electricity in the U.S. is powered by nuclear plants.
The dependency on Russian fuels dates back to the 1990s when the United States turned away from its own enrichment capabilities in favor of using down-blended stocks of Soviet-era weapons-grade uranium.
As part of the new uranium-ban bill, the Biden administration plans to allocate $2.2 billion for the expansion of uranium enrichment facilities in the United States.

-

 Electrification3 years ago
Ranked: The Top 10 EV Battery Manufacturers
-

 Electrification2 years ago
The Key Minerals in an EV Battery
-

 Real Assets2 years ago
The World’s Top 10 Gold Mining Companies
-

 Misc3 years ago
All the Metals We Mined in One Visualization
-

 Electrification3 years ago
The Biggest Mining Companies in the World in 2021
-

 Energy Shift2 years ago
What Are the Five Major Types of Renewable Energy?
-

 Electrification2 years ago
The World’s Largest Nickel Mining Companies
-

 Electrification2 years ago
Mapped: Solar Power by Country in 2021