

Energy Shift
Visualizing the EU’s Energy Dependency
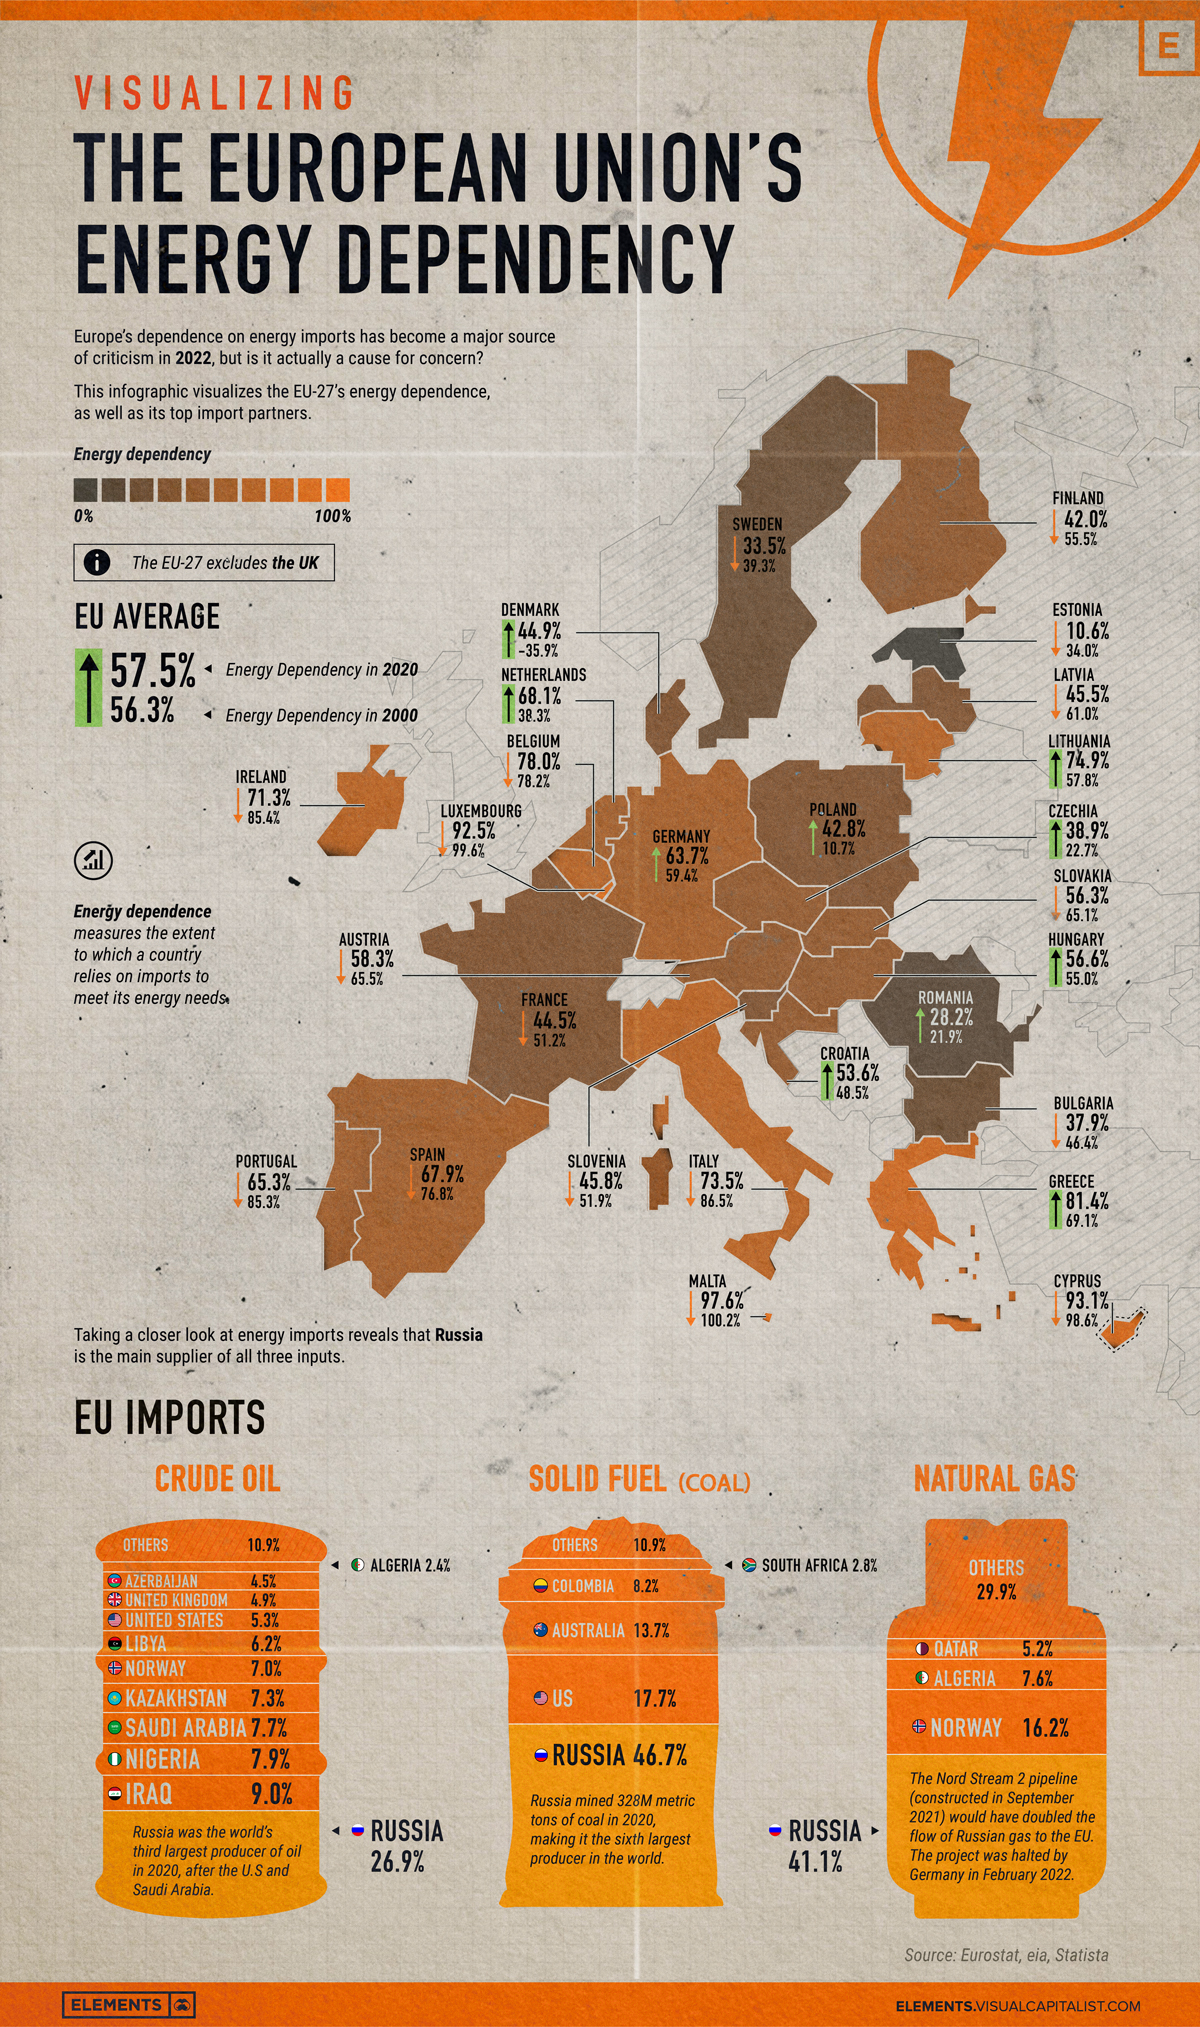
Visualizing the EU’s Energy Dependency
In response to Russia’s 2022 invasion of Ukraine, the U.S. and EU have imposed heavy sanctions aimed at crippling the Russian economy. However, these bold actions also come with some potentially messy complications: Russia is not only one of the world’s largest exporters of energy products, but it is also Europe’s biggest supplier of these fuels.
As of October 2021, Russia supplied 25% of all oil imported by the EU, which is three times more than the second-largest trade partner. Naturally, the policies and circumstances that have led to this dependency have been under major scrutiny in recent weeks.
To help you learn more, this infographic visualizes energy data from Eurostat.
Energy Dependency, by Country
To start, let’s compare the energy dependence of each EU member, both in 2000 and 2020 (the latest year available). This metric shows the extent to which a country relies upon imports to meet its energy needs.
Note that Denmark’s value of -35.9% for the year 2000 is not a typo. Rather, it means that the country was a net exporter of energy.
| Country | 2000 | 2020 |
|---|---|---|
| 🇦🇹 Austria | 65.5% | 58.3% |
| 🇧🇪 Belgium | 78.2% | 78.0% |
| 🇧🇬 Bulgaria | 46.4% | 37.9% |
| 🇭🇷 Croatia | 48.5% | 53.6% |
| 🇨🇾 Cyprus | 98.6% | 93.1% |
| 🇨🇿 Czechia | 22.7% | 38.9% |
| 🇩🇰 Denmark | -35.9% | 44.9% |
| 🇪🇪 Estonia | 34.0% | 10.6% |
| 🇫🇮 Finland | 55.5% | 42.0% |
| 🇫🇷 France | 51.2% | 44.5% |
| 🇩🇪 Germany | 59.4% | 63.7% |
| 🇬🇷 Greece | 69.1% | 81.4% |
| 🇭🇺 Hungary | 55.0% | 56.6% |
| 🇮🇪 Ireland | 85.4% | 71.3% |
| 🇮🇹 Italy | 86.5% | 73.5% |
| 🇱🇻 Latvia | 61.0% | 45.5% |
| 🇱🇹 Lithuania | 57.8% | 74.9% |
| 🇱🇺 Luxembourg | 99.6% | 92.5% |
| 🇲🇹 Malta | 100.2% | 97.6% |
| 🇳🇱 Netherlands | 38.3% | 68.1% |
| 🇵🇱 Poland | 10.7% | 42.8% |
| 🇵🇹 Portugal | 85.3% | 65.3% |
| 🇷🇴 Romania | 21.9% | 28.2% |
| 🇸🇰 Slovakia | 65.1% | 56.3% |
| 🇸🇮 Slovenia | 51.9% | 45.8% |
| 🇪🇸 Spain | 76.8% | 67.9% |
| 🇸🇪 Sweden | 39.3% | 33.5% |
| Average | 56.3% | 57.5% |
Over this 20-year timeframe, the EU-27 average country’s energy dependence has increased from 56.3% to 57.5%, meaning EU members became slightly more reliant on energy imports over those two decades.
Where Do EU’s Energy Imports Come From?
Looking further into energy imports reveals that Russia is the main supplier of crude oil, coal, and natural gas. Continue below for more details.
Crude Oil Imports
The EU imports more crude oil from Russia than the next three countries combined.
| Country | Percentage of total |
|---|---|
| 🇷🇺 Russia | 26.9% |
| 🇮🇶 Iraq | 9.0% |
| 🇳🇬 Nigeria | 7.9% |
| 🇸🇦 Saudi Arabia | 7.7% |
| 🇰🇿 Kazakhstan | 7.3% |
| 🇳🇴 Norway | 7.0% |
| 🇱🇾 Libya | 6.2% |
| 🇺🇸 United States | 5.3% |
| 🇬🇧 United Kingdom | 4.9% |
| 🇦🇿 Azerbaijan | 4.5% |
| 🇩🇿 Algeria | 2.4% |
| Others | 10.9% |
This shouldn’t come as a surprise, as Russia was the world’s third largest producer of oil in 2020. The country has several state-owned oil companies including Rosneft and Gazprom.
Coal Imports
Coal-fired power plants are still being used across the EU, though most member states expect to completely phase them out by 2030.
| Country | Percentage of total |
|---|---|
| 🇷🇺 Russia | 46.7% |
| 🇺🇸 United States | 17.7% |
| 🇦🇺 Australia | 13.7% |
| 🇨🇴 Colombia | 8.2% |
| 🇿🇦 South Africa | 2.8% |
| Others | 10.9% |
Russia has the second largest coal reserves in the world. In 2020, it mined 328 million metric tons, making it the sixth largest producer globally.
Natural Gas Imports
Natural gas is commonly used to heat buildings and water. A majority of the EU’s supply comes from Russia via the Nord Stream series of pipelines.
| Country | Percentage of total |
|---|---|
| 🇷🇺 Russia | 41.1% |
| 🇳🇴 Norway | 16.2% |
| 🇩🇿 Algeria | 7.6% |
| 🇶🇦 Qatar | 5.2% |
| Others | 29.9% |
Nord Stream 1 is the longest sub-sea pipeline in the world and was completed in 2011. It starts from the Russian city of Vyborg and connects to the EU through Germany.
Nord Stream 2 is a recently constructed expansion which was expected to double the project’s capacity. Germany has since halted the approval process for this pipeline in response to Russia’s 2022 invasion of Ukraine.
What Happens Now?
In retaliation against Western sanctions, Russia has announced an impending ban on exports of certain goods and raw materials.
European gas prices skyrocketed in response, as many fear that Russia could cut off natural gas supplies. This, of course, would have very negative effects on both consumers and businesses.
In early March 2022, both the European Commission and the International Energy Agency (IEA) introduced proposals on how Europe could reduce its energy dependency.
We must become independent from Russian oil, coal and gas. We simply cannot rely on a supplier who explicitly threatens us.
– Ursula von der Leyen, President of the European Commission
Cutting off one’s biggest supplier is likely to cause issues, especially when dealing with something as critical as energy. Few countries have the capacity (or willingness) to immediately replace Russian imports.
The proposals also discussed options for boosting Europe’s domestic output, though the commission’s report notably excluded nuclear power. For various reasons, nuclear remains a polarizing topic in Europe, with countries taking either a pro or anti stance.


Energy Shift
The World’s Biggest Oil Producers in 2023
Just three countries accounted for 40% of global oil production last year.

The World’s Biggest Oil Producers in 2023
This was originally posted on our Voronoi app. Download the app for free on iOS or Android and discover incredible data-driven charts from a variety of trusted sources.
Despite efforts to decarbonize the global economy, oil still remains one of the world’s most important resources. It’s also produced by a fairly limited group of countries, which can be a source of economic and political leverage.
This graphic illustrates global crude oil production in 2023, measured in million barrels per day, sourced from the U.S. Energy Information Administration (EIA).
Three Countries Account for 40% of Global Oil Production
In 2023, the United States, Russia, and Saudi Arabia collectively contributed 32.7 million barrels per day to global oil production.
| Oil Production 2023 | Million barrels per day |
|---|---|
| 🇺🇸 U.S. | 12.9 |
| 🇷🇺 Russia | 10.1 |
| 🇸🇦 Saudi Arabia | 9.7 |
| 🇨🇦 Canada | 4.6 |
| 🇮🇶 Iraq | 4.3 |
| 🇨🇳 China | 4.2 |
| 🇮🇷 Iran | 3.6 |
| 🇧🇷 Brazil | 3.4 |
| 🇦🇪 UAE | 3.4 |
| 🇰🇼 Kuwait | 2.7 |
| 🌍 Other | 22.8 |
These three nations have consistently dominated oil production since 1971. The leading position, however, has alternated among them over the past five decades.
In contrast, the combined production of the next three largest producers—Canada, Iraq, and China—reached 13.1 million barrels per day in 2023, just surpassing the production of the United States alone.
In the near term, no country is likely to surpass the record production achieved by the U.S. in 2023, as no other producer has ever reached a daily capacity of 13.0 million barrels. Recently, Saudi Arabia’s state-owned Saudi Aramco scrapped plans to increase production capacity to 13.0 million barrels per day by 2027.
In 2024, analysts forecast that the U.S. will maintain its position as the top oil producer. In fact, according to Macquarie Group, U.S. oil production is expected to achieve a record pace of about 14 million barrels per day by the end of the year.
Energy Shift
How Much Does the U.S. Depend on Russian Uranium?
Despite a new uranium ban being discussed in Congress, the U.S. is still heavily dependent on Russian uranium.

How Much Does the U.S. Depend on Russian Uranium?
This was originally posted on our Voronoi app. Download the app for free on iOS or Android and discover incredible data-driven charts from a variety of trusted sources.
The U.S. House of Representatives recently passed a ban on imports of Russian uranium. The bill must pass the Senate before becoming law.
In this graphic, we visualize how much the U.S. relies on Russian uranium, based on data from the United States Energy Information Administration (EIA).
U.S. Suppliers of Enriched Uranium
After Russia invaded Ukraine, the U.S. imposed sanctions on Russian-produced oil and gas—yet Russian-enriched uranium is still being imported.
Currently, Russia is the largest foreign supplier of nuclear power fuel to the United States. In 2022, Russia supplied almost a quarter of the enriched uranium used to fuel America’s fleet of more than 90 commercial reactors.
| Country of enrichment service | SWU* | % |
|---|---|---|
| 🇺🇸 United States | 3,876 | 27.34% |
| 🇷🇺 Russia | 3,409 | 24.04% |
| 🇩🇪 Germany | 1,763 | 12.40% |
| 🇬🇧 United Kingdom | 1,593 | 11.23% |
| 🇳🇱 Netherlands | 1,303 | 9.20% |
| Other | 2,232 | 15.79% |
| Total | 14,176 | 100% |
SWU stands for “Separative Work Unit” in the uranium industry. It is a measure of the amount of work required to separate isotopes of uranium during the enrichment process. Source: U.S. Energy Information Administration
Most of the remaining uranium is imported from European countries, while another portion is produced by a British-Dutch-German consortium operating in the United States called Urenco.
Similarly, nearly a dozen countries around the world depend on Russia for more than half of their enriched uranium—and many of them are NATO-allied members and allies of Ukraine.
In 2023 alone, the U.S. nuclear industry paid over $800 million to Russia’s state-owned nuclear energy corporation, Rosatom, and its fuel subsidiaries.
It is important to note that 19% of electricity in the U.S. is powered by nuclear plants.
The dependency on Russian fuels dates back to the 1990s when the United States turned away from its own enrichment capabilities in favor of using down-blended stocks of Soviet-era weapons-grade uranium.
As part of the new uranium-ban bill, the Biden administration plans to allocate $2.2 billion for the expansion of uranium enrichment facilities in the United States.

-

 Electrification3 years ago
Ranked: The Top 10 EV Battery Manufacturers
-

 Electrification2 years ago
The Key Minerals in an EV Battery
-

 Real Assets3 years ago
The World’s Top 10 Gold Mining Companies
-

 Misc3 years ago
All the Metals We Mined in One Visualization
-

 Electrification3 years ago
The Biggest Mining Companies in the World in 2021
-

 Energy Shift2 years ago
What Are the Five Major Types of Renewable Energy?
-

 Electrification2 years ago
The World’s Largest Nickel Mining Companies
-

 Electrification2 years ago
Mapped: Solar Power by Country in 2021