

Energy Shift
Visualizing Nuclear Power Production by Country
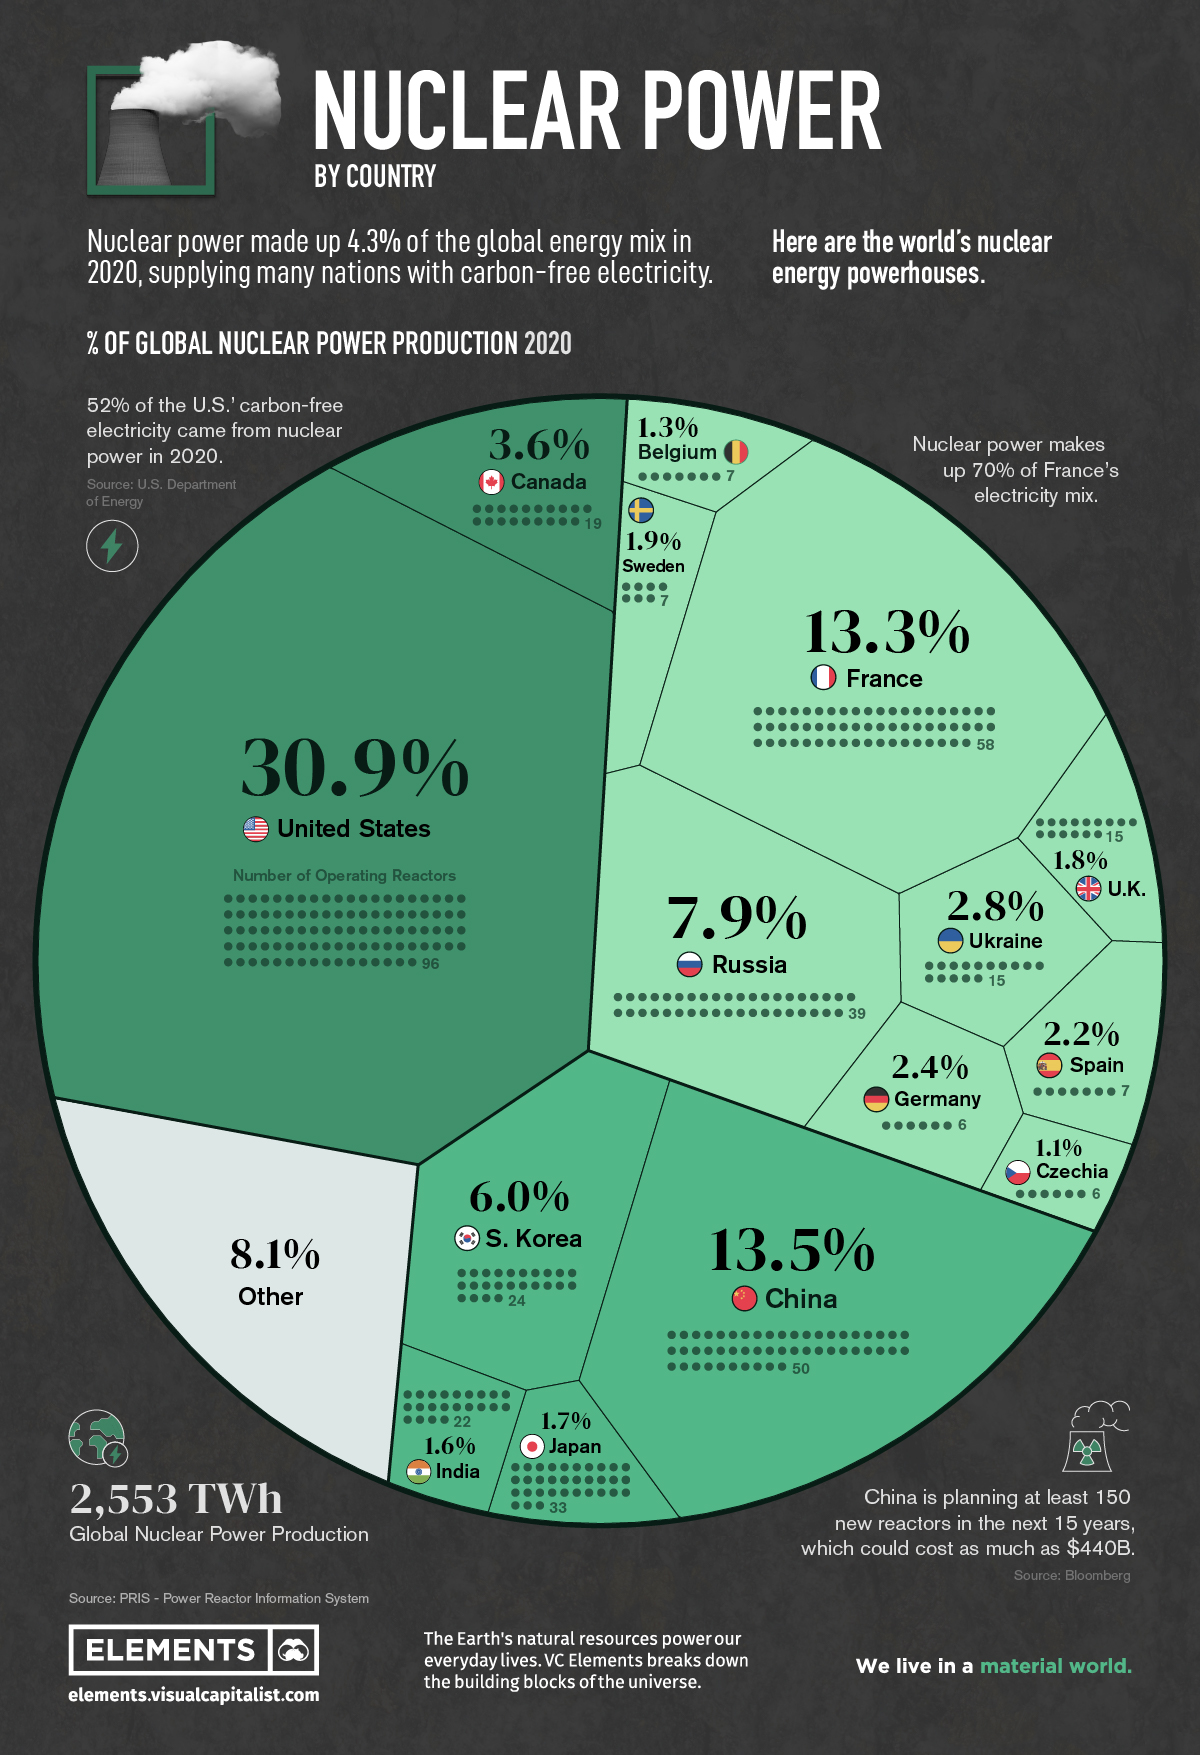
Nuclear Power Production by Country
Nearly 450 reactors around the world supply various nations with nuclear power, combining for about 10% of the world’s electricity, or about 4% of the global energy mix.
But while some countries are turning to nuclear as a clean energy source, nuclear energy generation overall has seen a slowdown since its peak in the 1990s.
The above infographic breaks down nuclear electricity generation by country in 2020 using data from the Power Reactor Information System (PRIS).
Ranked: The Top 15 Countries for Nuclear Power
Just 15 countries account for more than 91% of global nuclear power production. Here’s how much energy these countries produced in 2020:
| Rank | Country | Number of Operating Reactors | Nuclear Electricity Supplied [GWh] | % share |
|---|---|---|---|---|
| #1 | U.S. 🇺🇸 | 96 | 789,919 | 30.9% |
| #2 | China 🇨🇳 | 50 | 344,748 | 13.5% |
| #3 | France 🇫🇷 | 58 | 338,671 | 13.3% |
| #4 | Russia 🇷🇺 | 39 | 201,821 | 7.9% |
| #5 | South Korea 🇰🇷 | 24 | 152,583 | 6.0% |
| #6 | Canada 🇨🇦 | 19 | 92,166 | 3.6% |
| #7 | Ukraine 🇺🇦 | 15 | 71,550 | 2.8% |
| #8 | Germany 🇩🇪 | 6 | 60,918 | 2.4% |
| #9 | Spain 🇪🇸 | 7 | 55,825 | 2.2% |
| #10 | Sweden 🇸🇪 | 7 | 47,362 | 1.9% |
| #11 | U.K. 🇬🇧 | 15 | 45,668 | 1.8% |
| #12 | Japan 🇯🇵 | 33 | 43,099 | 1.7% |
| #13 | India 🇮🇳 | 22 | 40,374 | 1.6% |
| #14 | Belgium 🇧🇪 | 7 | 32,793 | 1.3% |
| #15 | Czechia 🇨🇿 | 6 | 28,372 | 1.1% |
| Rest of the World 🌎 | 44 | 207,340 | 8.1% | |
| Total | 448 | 2,553,208 | 100.0% |
In the U.S., nuclear power produces over 50% of the country’s clean electricity. Additionally, 88 of the country’s 96 operating reactors in 2020 received approvals for a 20-year life extension.
China, the world’s second-largest nuclear power producer, is investing further in nuclear energy in a bid to achieve its climate goals. The plan, which includes building 150 new reactors by 2035, could cost as much as $440 billion.
On the other hand, European opinions on nuclear energy are mixed. Germany is the eighth-largest on the list but plans to shutter its last operating reactor in 2022 as part of its nuclear phase-out. France, meanwhile, plans to expand its nuclear capacity.
Which Countries Rely Most on Nuclear Energy?
Although total electricity generation is useful for a high-level global comparison, it’s important to remember that there are some smaller countries not featured above where nuclear is still an important part of the electricity mix.
Here’s a breakdown based on the share of nuclear energy in a country’s electricity mix:
| Rank | Country | Nuclear Share of Electricity Mix |
|---|---|---|
| #1 | France 🇫🇷 | 70.6% |
| #2 | Slovakia 🇸🇰 | 53.1% |
| #3 | Ukraine 🇺🇦 | 51.2% |
| #4 | Hungary 🇭🇺 | 48.0% |
| #5 | Bulgaria 🇧🇬 | 40.8% |
| #6 | Belgium 🇧🇪 | 39.1% |
| #7 | Slovenia 🇸🇮 | 37.8% |
| #8 | Czechia 🇨🇿 | 37.3% |
| #9 | Armenia 🇦🇲 | 34.5% |
| #10 | Finland 🇫🇮 | 33.9% |
| #11 | Switzerland 🇨🇭 | 32.9% |
| #12 | Sweden 🇸🇪 | 29.8% |
| #13 | South Korea 🇰🇷 | 29.6% |
| #14 | Spain 🇪🇸 | 22.2% |
| #15 | Russia 🇷🇺 | 20.6% |
| #16 | Romania 🇷🇴 | 19.9% |
| #17 | United States 🇺🇸 | 19.7% |
| #18 | Canada 🇨🇦 | 14.6% |
| #19 | United Kingdom 🇬🇧 | 14.5% |
| #20 | Germany 🇩🇪 | 11.3% |
European countries dominate the leaderboard with 14 of the top 15 spots, including France, where nuclear power is the country’s largest source of electricity.
It’s interesting to note that only a few of these countries are top producers of nuclear in absolute terms. For example, in Slovakia, nuclear makes up 53.6% of the electricity mix—however, the country’s four reactors make up less than 1% of total global operating capacity.
On the flipside, the U.S. ranks 17th by share of nuclear power in its mix, despite producing 31% of global nuclear electricity in 2020. This discrepancy is largely due to size and population. European countries are much smaller and produce less electricity overall than larger countries like the U.S. and China.
The Future of Nuclear Power
The nuclear power landscape is constantly changing.
There were over 50 additional nuclear reactors under construction in 2020, and hundreds more are planned primarily in Asia.
As countries turn away from fossil fuels and embrace carbon-free energy sources, nuclear energy might see a resurgence in the global energy mix despite the phase-outs planned in several countries around he globe.


Energy Shift
The World’s Biggest Oil Producers in 2023
Just three countries accounted for 40% of global oil production last year.

The World’s Biggest Oil Producers in 2023
This was originally posted on our Voronoi app. Download the app for free on iOS or Android and discover incredible data-driven charts from a variety of trusted sources.
Despite efforts to decarbonize the global economy, oil still remains one of the world’s most important resources. It’s also produced by a fairly limited group of countries, which can be a source of economic and political leverage.
This graphic illustrates global crude oil production in 2023, measured in million barrels per day, sourced from the U.S. Energy Information Administration (EIA).
Three Countries Account for 40% of Global Oil Production
In 2023, the United States, Russia, and Saudi Arabia collectively contributed 32.7 million barrels per day to global oil production.
| Oil Production 2023 | Million barrels per day |
|---|---|
| 🇺🇸 U.S. | 12.9 |
| 🇷🇺 Russia | 10.1 |
| 🇸🇦 Saudi Arabia | 9.7 |
| 🇨🇦 Canada | 4.6 |
| 🇮🇶 Iraq | 4.3 |
| 🇨🇳 China | 4.2 |
| 🇮🇷 Iran | 3.6 |
| 🇧🇷 Brazil | 3.4 |
| 🇦🇪 UAE | 3.4 |
| 🇰🇼 Kuwait | 2.7 |
| 🌍 Other | 22.8 |
These three nations have consistently dominated oil production since 1971. The leading position, however, has alternated among them over the past five decades.
In contrast, the combined production of the next three largest producers—Canada, Iraq, and China—reached 13.1 million barrels per day in 2023, just surpassing the production of the United States alone.
In the near term, no country is likely to surpass the record production achieved by the U.S. in 2023, as no other producer has ever reached a daily capacity of 13.0 million barrels. Recently, Saudi Arabia’s state-owned Saudi Aramco scrapped plans to increase production capacity to 13.0 million barrels per day by 2027.
In 2024, analysts forecast that the U.S. will maintain its position as the top oil producer. In fact, according to Macquarie Group, U.S. oil production is expected to achieve a record pace of about 14 million barrels per day by the end of the year.
Energy Shift
How Much Does the U.S. Depend on Russian Uranium?
Despite a new uranium ban being discussed in Congress, the U.S. is still heavily dependent on Russian uranium.

How Much Does the U.S. Depend on Russian Uranium?
This was originally posted on our Voronoi app. Download the app for free on iOS or Android and discover incredible data-driven charts from a variety of trusted sources.
The U.S. House of Representatives recently passed a ban on imports of Russian uranium. The bill must pass the Senate before becoming law.
In this graphic, we visualize how much the U.S. relies on Russian uranium, based on data from the United States Energy Information Administration (EIA).
U.S. Suppliers of Enriched Uranium
After Russia invaded Ukraine, the U.S. imposed sanctions on Russian-produced oil and gas—yet Russian-enriched uranium is still being imported.
Currently, Russia is the largest foreign supplier of nuclear power fuel to the United States. In 2022, Russia supplied almost a quarter of the enriched uranium used to fuel America’s fleet of more than 90 commercial reactors.
| Country of enrichment service | SWU* | % |
|---|---|---|
| 🇺🇸 United States | 3,876 | 27.34% |
| 🇷🇺 Russia | 3,409 | 24.04% |
| 🇩🇪 Germany | 1,763 | 12.40% |
| 🇬🇧 United Kingdom | 1,593 | 11.23% |
| 🇳🇱 Netherlands | 1,303 | 9.20% |
| Other | 2,232 | 15.79% |
| Total | 14,176 | 100% |
SWU stands for “Separative Work Unit” in the uranium industry. It is a measure of the amount of work required to separate isotopes of uranium during the enrichment process. Source: U.S. Energy Information Administration
Most of the remaining uranium is imported from European countries, while another portion is produced by a British-Dutch-German consortium operating in the United States called Urenco.
Similarly, nearly a dozen countries around the world depend on Russia for more than half of their enriched uranium—and many of them are NATO-allied members and allies of Ukraine.
In 2023 alone, the U.S. nuclear industry paid over $800 million to Russia’s state-owned nuclear energy corporation, Rosatom, and its fuel subsidiaries.
It is important to note that 19% of electricity in the U.S. is powered by nuclear plants.
The dependency on Russian fuels dates back to the 1990s when the United States turned away from its own enrichment capabilities in favor of using down-blended stocks of Soviet-era weapons-grade uranium.
As part of the new uranium-ban bill, the Biden administration plans to allocate $2.2 billion for the expansion of uranium enrichment facilities in the United States.

-

 Electrification3 years ago
Ranked: The Top 10 EV Battery Manufacturers
-

 Electrification2 years ago
The Key Minerals in an EV Battery
-

 Real Assets2 years ago
The World’s Top 10 Gold Mining Companies
-

 Misc3 years ago
All the Metals We Mined in One Visualization
-

 Electrification3 years ago
The Biggest Mining Companies in the World in 2021
-

 Energy Shift2 years ago
What Are the Five Major Types of Renewable Energy?
-

 Electrification2 years ago
The World’s Largest Nickel Mining Companies
-

 Electrification2 years ago
Mapped: Solar Power by Country in 2021