

Energy Shift
Visualizing China’s Dominance in Clean Energy Metals
Visualizing China’s Dominance in Clean Energy Metals
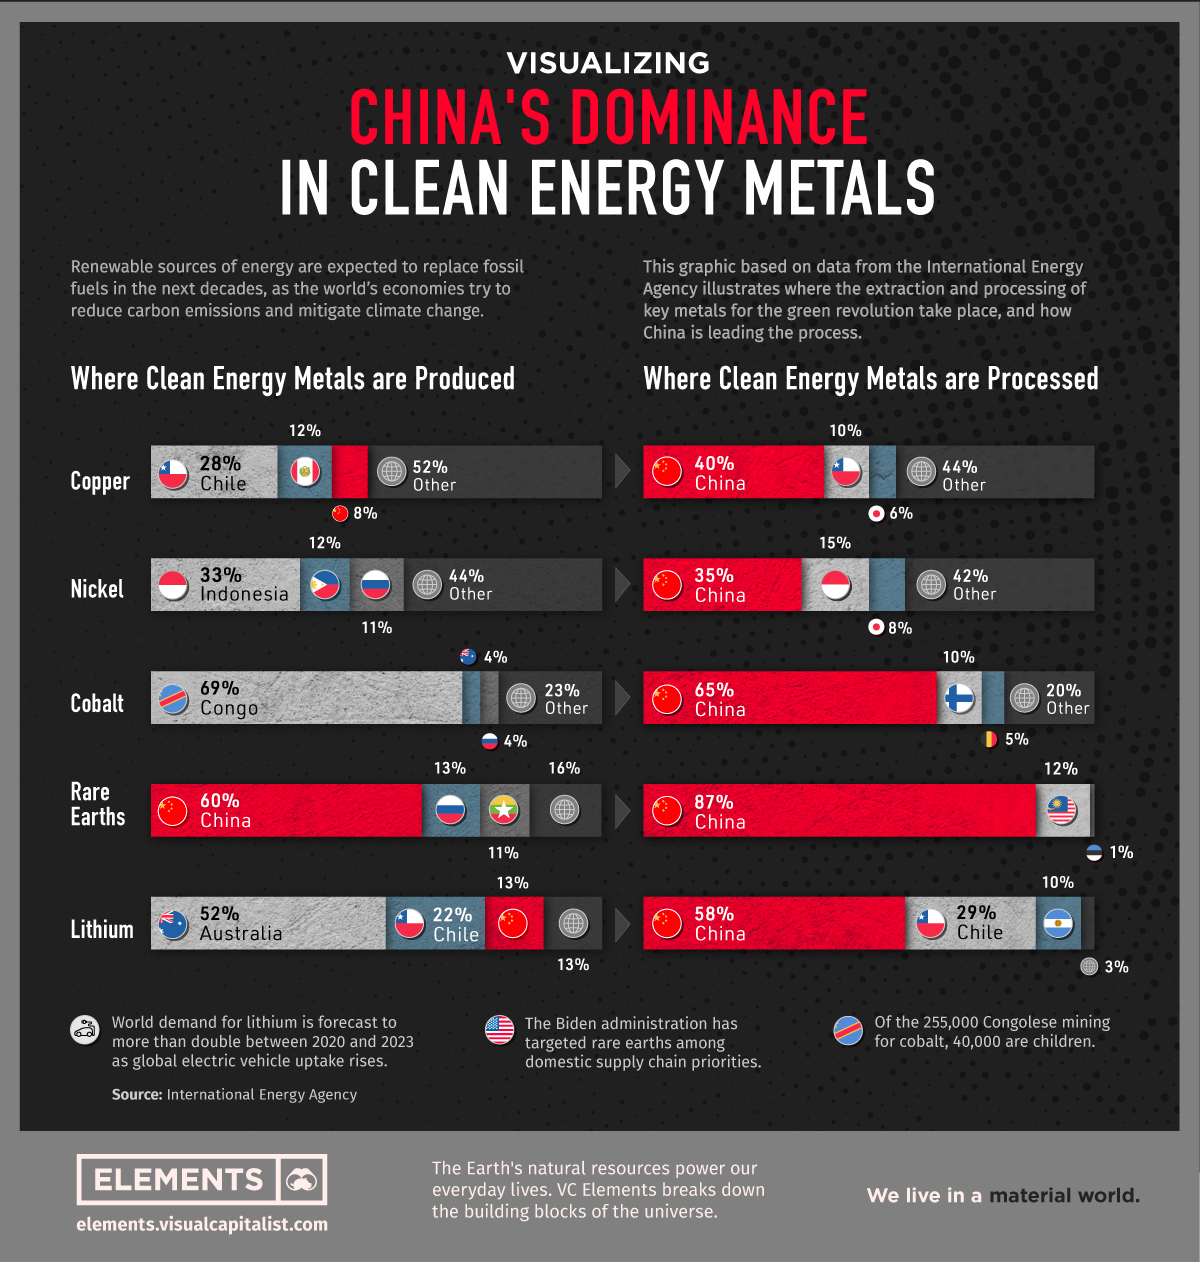
Renewable sources of energy are expected to replace fossil fuels over the coming decades, and this large-scale transition will have a downstream effect on the demand of raw materials. More green energy means more wind turbines, solar panels, and batteries needed, and more clean energy metals necessary to build these technologies.
Today’s graphic, based on data from the International Energy Agency (IEA), illustrates where the extraction and processing of key metals for the green revolution take place.
It shows that despite being the world’s biggest carbon polluter, China is also the largest producer of most of the world’s critical minerals for the green revolution.
Where Clean Energy Metals are Produced
China produces 60% of all rare earth elements used as components in high technology devices, including smartphones and computers.
The country also has a 13% share of the lithium production market, which is still dominated by Australia (52%) and Chile (22%). The highly reactive element is key to producing rechargeable batteries for mobile phones, laptops, and electric vehicles.
| China's Share | Extraction | Processing |
|---|---|---|
| Copper | 8% | 40% |
| Nickel | 5% | 35% |
| Cobalt | 1.5% | 65% |
| Rare Earths | 60% | 87% |
| Lithium | 13% | 58% |
But even more than extraction, China is the dominant economy when it comes to processing operations. The country’s share of refining is around 35% for nickel, 58% for lithium, 65% for cobalt, and 87% for rare earth elements.
Despite being the largest economy in the world, the U.S. does not appear among the largest producers of any of the metals listed. To shorten the gap, the Biden administration recently launched an executive order to review the American strategy for critical and strategic materials.
It’s also worth noting that Russia also does not appear among the top producers when it comes to clean energy metals, despite being one of the world’s leading producers of minerals like copper, iron, and palladium.
Low Regulation in the Clean Metal Supply Chain
While China leads all countries in terms of cobalt processing, the metal itself is primarily extracted in the Democratic Republic of Congo (DRC). Still, Chinese interests own 15 of the 17 industrial cobalt operations in the DRC, according to a data analysis by The New York Times and Benchmark Mineral Intelligence.
Unfortunately, the DRC’s cobalt production has been criticized due to reports of corruption and lack of regulation.
Part of the Congolese cobalt comes from artisanal mines with low regulation. Of the 255,000 Congolese artisanal miners, an estimated 40,000 are children, some as young as six years old.
The Rise of Clean Energy Metals
The necessary shift from fossil fuels to renewable energy opens up interesting questions about how geopolitics, and these supply chains, will be affected.
In the race to secure raw materials needed for the green revolution, new world powers could emerge as demand for clean energy metals grows.
For now, China has the lead.


Energy Shift
The World’s Biggest Oil Producers in 2023
Just three countries accounted for 40% of global oil production last year.

The World’s Biggest Oil Producers in 2023
This was originally posted on our Voronoi app. Download the app for free on iOS or Android and discover incredible data-driven charts from a variety of trusted sources.
Despite efforts to decarbonize the global economy, oil still remains one of the world’s most important resources. It’s also produced by a fairly limited group of countries, which can be a source of economic and political leverage.
This graphic illustrates global crude oil production in 2023, measured in million barrels per day, sourced from the U.S. Energy Information Administration (EIA).
Three Countries Account for 40% of Global Oil Production
In 2023, the United States, Russia, and Saudi Arabia collectively contributed 32.7 million barrels per day to global oil production.
| Oil Production 2023 | Million barrels per day |
|---|---|
| 🇺🇸 U.S. | 12.9 |
| 🇷🇺 Russia | 10.1 |
| 🇸🇦 Saudi Arabia | 9.7 |
| 🇨🇦 Canada | 4.6 |
| 🇮🇶 Iraq | 4.3 |
| 🇨🇳 China | 4.2 |
| 🇮🇷 Iran | 3.6 |
| 🇧🇷 Brazil | 3.4 |
| 🇦🇪 UAE | 3.4 |
| 🇰🇼 Kuwait | 2.7 |
| 🌍 Other | 22.8 |
These three nations have consistently dominated oil production since 1971. The leading position, however, has alternated among them over the past five decades.
In contrast, the combined production of the next three largest producers—Canada, Iraq, and China—reached 13.1 million barrels per day in 2023, just surpassing the production of the United States alone.
In the near term, no country is likely to surpass the record production achieved by the U.S. in 2023, as no other producer has ever reached a daily capacity of 13.0 million barrels. Recently, Saudi Arabia’s state-owned Saudi Aramco scrapped plans to increase production capacity to 13.0 million barrels per day by 2027.
In 2024, analysts forecast that the U.S. will maintain its position as the top oil producer. In fact, according to Macquarie Group, U.S. oil production is expected to achieve a record pace of about 14 million barrels per day by the end of the year.
Energy Shift
How Much Does the U.S. Depend on Russian Uranium?
Despite a new uranium ban being discussed in Congress, the U.S. is still heavily dependent on Russian uranium.

How Much Does the U.S. Depend on Russian Uranium?
This was originally posted on our Voronoi app. Download the app for free on iOS or Android and discover incredible data-driven charts from a variety of trusted sources.
The U.S. House of Representatives recently passed a ban on imports of Russian uranium. The bill must pass the Senate before becoming law.
In this graphic, we visualize how much the U.S. relies on Russian uranium, based on data from the United States Energy Information Administration (EIA).
U.S. Suppliers of Enriched Uranium
After Russia invaded Ukraine, the U.S. imposed sanctions on Russian-produced oil and gas—yet Russian-enriched uranium is still being imported.
Currently, Russia is the largest foreign supplier of nuclear power fuel to the United States. In 2022, Russia supplied almost a quarter of the enriched uranium used to fuel America’s fleet of more than 90 commercial reactors.
| Country of enrichment service | SWU* | % |
|---|---|---|
| 🇺🇸 United States | 3,876 | 27.34% |
| 🇷🇺 Russia | 3,409 | 24.04% |
| 🇩🇪 Germany | 1,763 | 12.40% |
| 🇬🇧 United Kingdom | 1,593 | 11.23% |
| 🇳🇱 Netherlands | 1,303 | 9.20% |
| Other | 2,232 | 15.79% |
| Total | 14,176 | 100% |
SWU stands for “Separative Work Unit” in the uranium industry. It is a measure of the amount of work required to separate isotopes of uranium during the enrichment process. Source: U.S. Energy Information Administration
Most of the remaining uranium is imported from European countries, while another portion is produced by a British-Dutch-German consortium operating in the United States called Urenco.
Similarly, nearly a dozen countries around the world depend on Russia for more than half of their enriched uranium—and many of them are NATO-allied members and allies of Ukraine.
In 2023 alone, the U.S. nuclear industry paid over $800 million to Russia’s state-owned nuclear energy corporation, Rosatom, and its fuel subsidiaries.
It is important to note that 19% of electricity in the U.S. is powered by nuclear plants.
The dependency on Russian fuels dates back to the 1990s when the United States turned away from its own enrichment capabilities in favor of using down-blended stocks of Soviet-era weapons-grade uranium.
As part of the new uranium-ban bill, the Biden administration plans to allocate $2.2 billion for the expansion of uranium enrichment facilities in the United States.

-

 Electrification3 years ago
Ranked: The Top 10 EV Battery Manufacturers
-

 Electrification2 years ago
The Key Minerals in an EV Battery
-

 Real Assets3 years ago
The World’s Top 10 Gold Mining Companies
-

 Misc3 years ago
All the Metals We Mined in One Visualization
-

 Electrification3 years ago
The Biggest Mining Companies in the World in 2021
-

 Energy Shift2 years ago
What Are the Five Major Types of Renewable Energy?
-

 Electrification2 years ago
The World’s Largest Nickel Mining Companies
-

 Electrification2 years ago
Mapped: Solar Power by Country in 2021