

Energy Shift
Uranium: The Fuel for Clean Energy
The following content is sponsored by the Skyharbour Resources
Uranium: The Fuel for Clean Energy
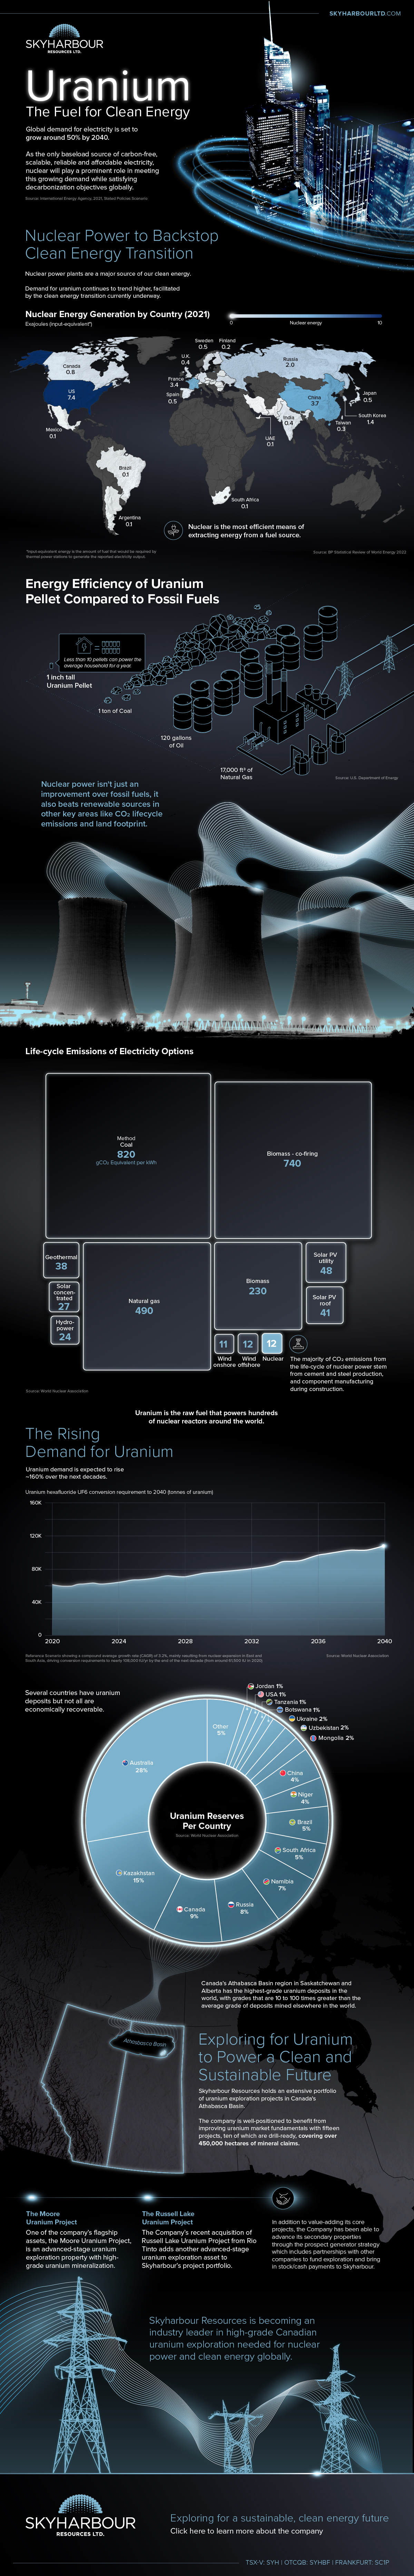
Global demand for electricity is set to grow around 50% by 2040.
As the only energy source of low-carbon, scalable, reliable, and affordable electricity, nuclear is set to play a prominent role in meeting this growing demand while satisfying decarbonization objectives globally.
In this infographic from Skyharbour Resources, we take a closer look at how uranium is shaping the future of energy.
Nuclear Power to Backstop Clean Energy Transition
Nuclear is considered an important source of clean energy, being the second largest source of low-carbon electricity in the world behind hydropower.
Nuclear power plants produce no greenhouse gas emissions during operation, and over the course of their life cycle, they produce about the same amount of carbon dioxide-equivalent emissions per unit of electricity as wind, and one-third of the emissions per unit of electricity when compared with solar.
Nuclear fuel is extremely dense and generates minimal waste. All of the used nuclear fuel produced by the U.S. over the last 60 years could fit on a football field at a depth of fewer than 10 yards.
To power up reactors, uranium demand is expected to rise ∼160% over the next decades.
Several countries are going nuclear in a bid to reduce reliance on fossil fuels while building reliable energy grids. Not many, however, have uranium deposits that are economically recoverable.
| Country | Tonnes of Uranium | Resource Percentage |
|---|---|---|
| 🇦🇺 Australia | 1,692,700 | 28% |
| 🇰🇿 Kazakhstan | 906,800 | 15% |
| 🇨🇦 Canada | 564,900 | 9% |
| 🇷🇺 Russia | 486,000 | 8% |
| 🇳🇦 Namibia | 448,300 | 7% |
| 🇿🇦 South Africa | 320,900 | 5% |
| 🇧🇷 Brazil | 276,800 | 5% |
| 🇳🇪 Niger | 276,400 | 4% |
| 🇨🇳 China | 248,900 | 4% |
| 🇲🇳 Mongolia | 143,500 | 2% |
| 🇺🇿 Uzbekistan | 132,300 | 2% |
| 🇺🇦 Ukraine | 108,700 | 2% |
| 🇧🇼 Botswana | 87,200 | 1% |
| 🇹🇿 Tanzania | 58,200 | 1% |
| 🇯🇴 Jordan | 52,500 | 1% |
| 🇺🇸 USA | 47,900 | 1% |
| Other | 295,800 | 5% |
| 🌐 World total | 6,147,800 | 100% |
Canada has the world’s largest deposits of high-grade uranium with grades of up to 20% uranium.
The Highest-Grade Uranium Deposits in the World
Canada’s Athabasca Basin region in Saskatchewan and Alberta has the highest-grade uranium deposits in the world, with grades that are 10 to 100 times greater than the average grade of deposits elsewhere.
Uranium was first discovered in the Athabasca Basin in 1934, and today the region remains a major hot spot for uranium exploration.
Besides hosting the richest uranium grades in the world, the region is a top-tier mining jurisdiction, with the best practices for environmental protection.
In recent years, a number of junior uranium companies have made exciting new discoveries in the basin, with Skyharbour Resources among them. The company holds an extensive portfolio of fifteen uranium exploration projects, ten of which are drill-ready, covering 450,000 hectares of mineral claims.
Skyharbour Resources is becoming an industry leader in high-grade Canadian uranium exploration needed for nuclear power and clean energy.


Energy Shift
The World’s Biggest Oil Producers in 2023
Just three countries accounted for 40% of global oil production last year.

The World’s Biggest Oil Producers in 2023
This was originally posted on our Voronoi app. Download the app for free on iOS or Android and discover incredible data-driven charts from a variety of trusted sources.
Despite efforts to decarbonize the global economy, oil still remains one of the world’s most important resources. It’s also produced by a fairly limited group of countries, which can be a source of economic and political leverage.
This graphic illustrates global crude oil production in 2023, measured in million barrels per day, sourced from the U.S. Energy Information Administration (EIA).
Three Countries Account for 40% of Global Oil Production
In 2023, the United States, Russia, and Saudi Arabia collectively contributed 32.7 million barrels per day to global oil production.
| Oil Production 2023 | Million barrels per day |
|---|---|
| 🇺🇸 U.S. | 12.9 |
| 🇷🇺 Russia | 10.1 |
| 🇸🇦 Saudi Arabia | 9.7 |
| 🇨🇦 Canada | 4.6 |
| 🇮🇶 Iraq | 4.3 |
| 🇨🇳 China | 4.2 |
| 🇮🇷 Iran | 3.6 |
| 🇧🇷 Brazil | 3.4 |
| 🇦🇪 UAE | 3.4 |
| 🇰🇼 Kuwait | 2.7 |
| 🌍 Other | 22.8 |
These three nations have consistently dominated oil production since 1971. The leading position, however, has alternated among them over the past five decades.
In contrast, the combined production of the next three largest producers—Canada, Iraq, and China—reached 13.1 million barrels per day in 2023, just surpassing the production of the United States alone.
In the near term, no country is likely to surpass the record production achieved by the U.S. in 2023, as no other producer has ever reached a daily capacity of 13.0 million barrels. Recently, Saudi Arabia’s state-owned Saudi Aramco scrapped plans to increase production capacity to 13.0 million barrels per day by 2027.
In 2024, analysts forecast that the U.S. will maintain its position as the top oil producer. In fact, according to Macquarie Group, U.S. oil production is expected to achieve a record pace of about 14 million barrels per day by the end of the year.
Energy Shift
How Much Does the U.S. Depend on Russian Uranium?
Despite a new uranium ban being discussed in Congress, the U.S. is still heavily dependent on Russian uranium.

How Much Does the U.S. Depend on Russian Uranium?
This was originally posted on our Voronoi app. Download the app for free on iOS or Android and discover incredible data-driven charts from a variety of trusted sources.
The U.S. House of Representatives recently passed a ban on imports of Russian uranium. The bill must pass the Senate before becoming law.
In this graphic, we visualize how much the U.S. relies on Russian uranium, based on data from the United States Energy Information Administration (EIA).
U.S. Suppliers of Enriched Uranium
After Russia invaded Ukraine, the U.S. imposed sanctions on Russian-produced oil and gas—yet Russian-enriched uranium is still being imported.
Currently, Russia is the largest foreign supplier of nuclear power fuel to the United States. In 2022, Russia supplied almost a quarter of the enriched uranium used to fuel America’s fleet of more than 90 commercial reactors.
| Country of enrichment service | SWU* | % |
|---|---|---|
| 🇺🇸 United States | 3,876 | 27.34% |
| 🇷🇺 Russia | 3,409 | 24.04% |
| 🇩🇪 Germany | 1,763 | 12.40% |
| 🇬🇧 United Kingdom | 1,593 | 11.23% |
| 🇳🇱 Netherlands | 1,303 | 9.20% |
| Other | 2,232 | 15.79% |
| Total | 14,176 | 100% |
SWU stands for “Separative Work Unit” in the uranium industry. It is a measure of the amount of work required to separate isotopes of uranium during the enrichment process. Source: U.S. Energy Information Administration
Most of the remaining uranium is imported from European countries, while another portion is produced by a British-Dutch-German consortium operating in the United States called Urenco.
Similarly, nearly a dozen countries around the world depend on Russia for more than half of their enriched uranium—and many of them are NATO-allied members and allies of Ukraine.
In 2023 alone, the U.S. nuclear industry paid over $800 million to Russia’s state-owned nuclear energy corporation, Rosatom, and its fuel subsidiaries.
It is important to note that 19% of electricity in the U.S. is powered by nuclear plants.
The dependency on Russian fuels dates back to the 1990s when the United States turned away from its own enrichment capabilities in favor of using down-blended stocks of Soviet-era weapons-grade uranium.
As part of the new uranium-ban bill, the Biden administration plans to allocate $2.2 billion for the expansion of uranium enrichment facilities in the United States.

-

 Electrification3 years ago
Ranked: The Top 10 EV Battery Manufacturers
-

 Electrification2 years ago
The Key Minerals in an EV Battery
-

 Real Assets2 years ago
The World’s Top 10 Gold Mining Companies
-

 Misc3 years ago
All the Metals We Mined in One Visualization
-

 Electrification3 years ago
The Biggest Mining Companies in the World in 2021
-

 Energy Shift2 years ago
What Are the Five Major Types of Renewable Energy?
-

 Electrification2 years ago
The World’s Largest Nickel Mining Companies
-

 Electrification2 years ago
Mapped: Solar Power by Country in 2021