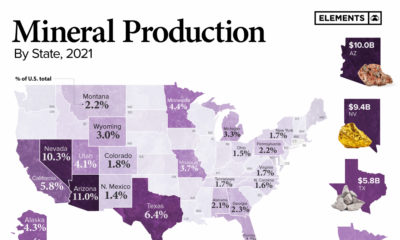

This infographic breaks down $90.4 billion in non-fuel mineral production by state.
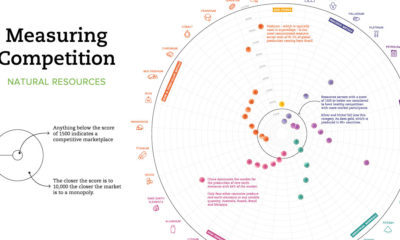

Which resource markets have healthy levels of competition, and which are more monopolistic? This chart shows the global level of competition for 33 minerals.


