

Energy Shift
Explainer: The Science of Nuclear Fusion
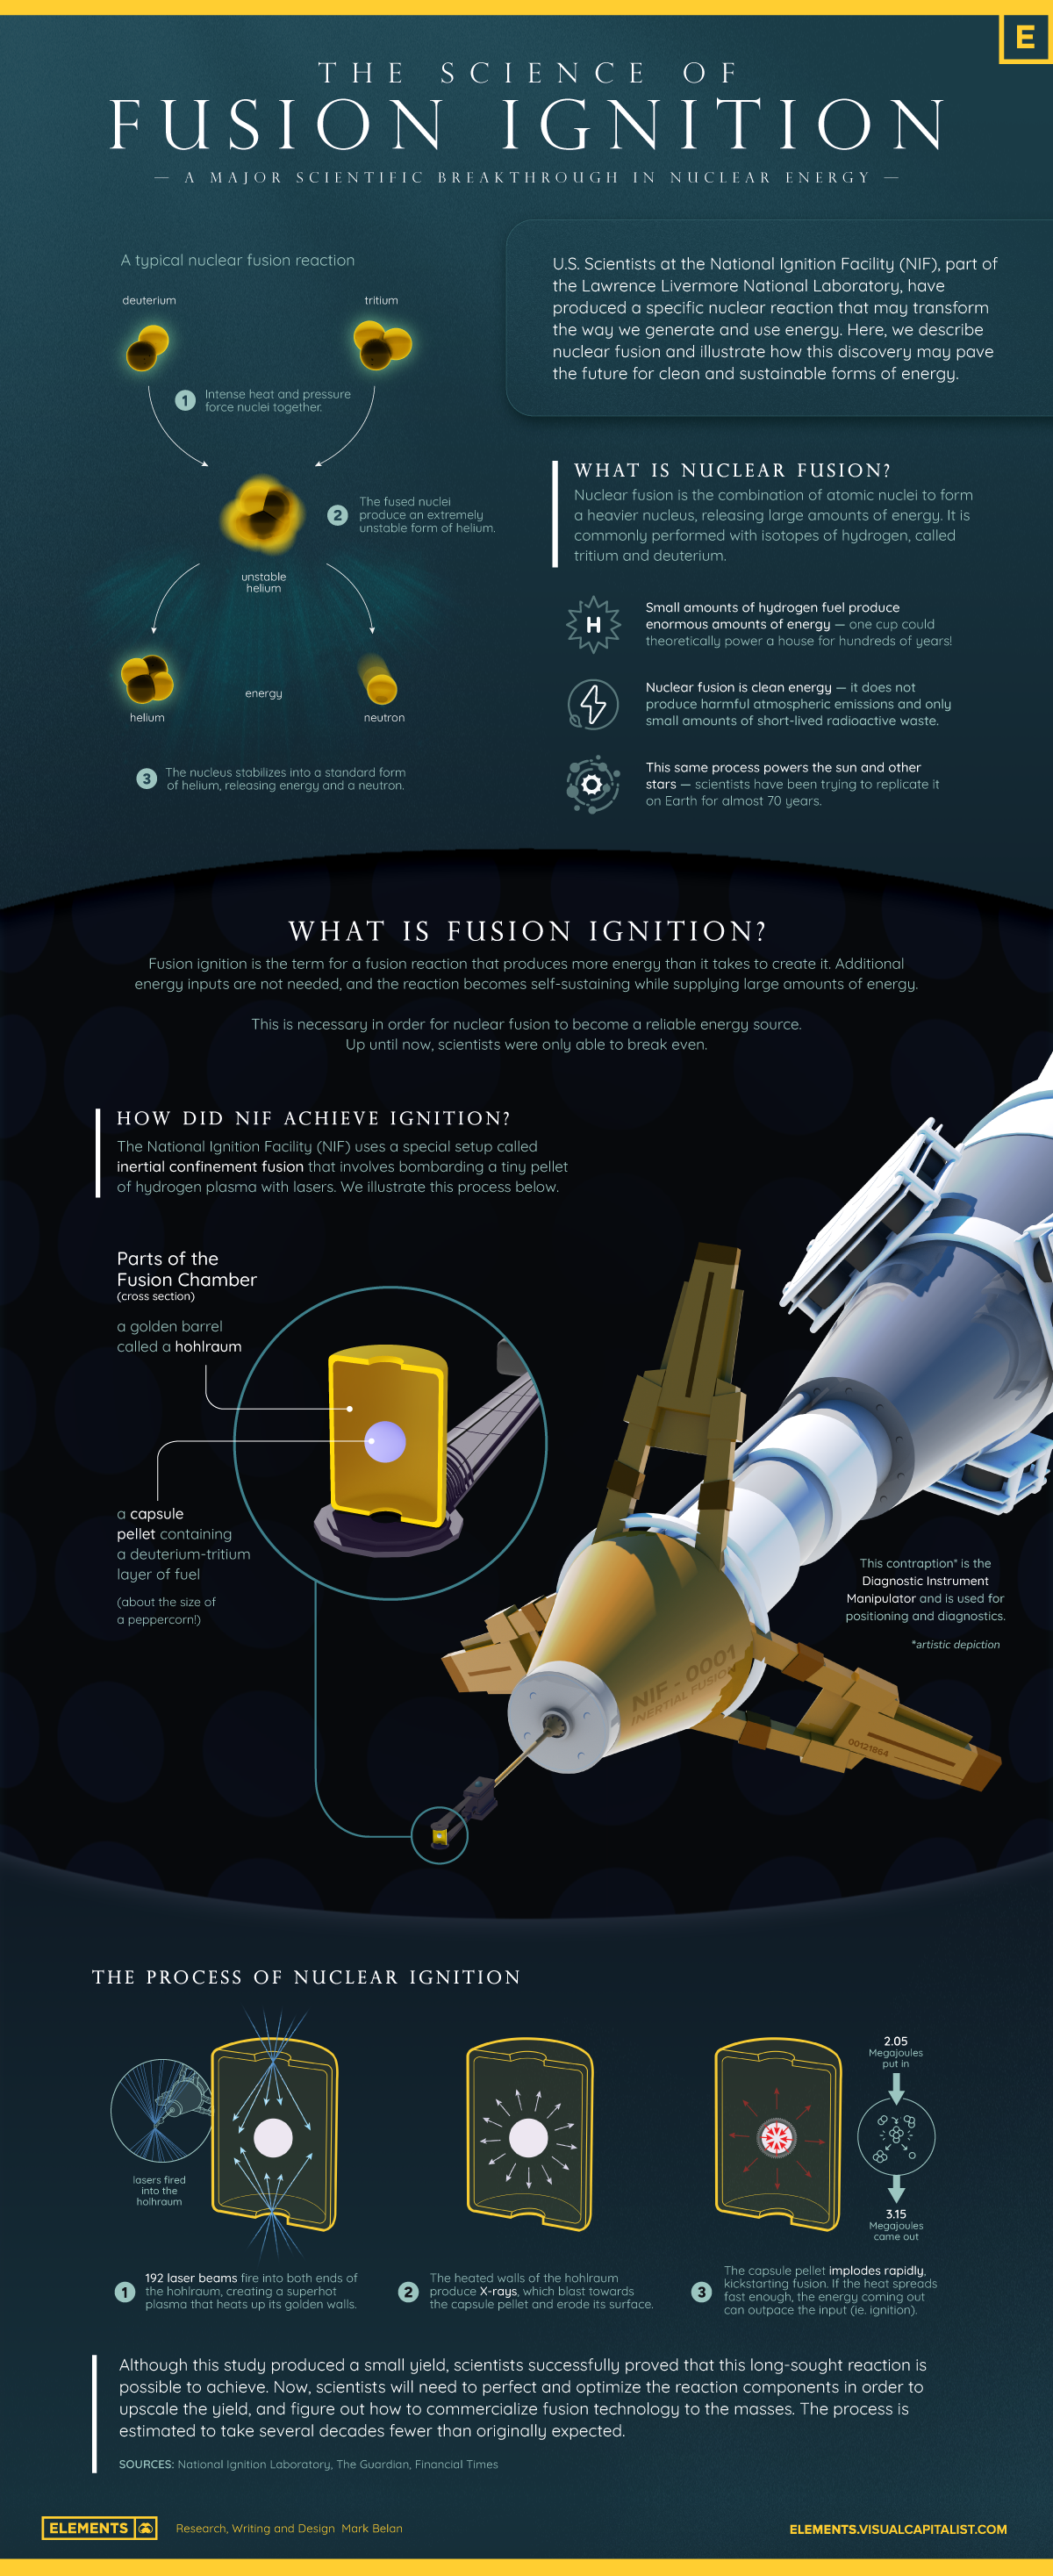
The Science of Nuclear Fusion
U.S. scientists at the National Ignition Facility, part of the Lawrence Livermore National Laboratory (LLNL), announced a major breakthrough in nuclear fusion this week.
For the first time ever, scientists successfully produced more energy from a nuclear fusion experiment than the laser energy used to power it.
In the above infographic, we describe nuclear fusion and illustrate how this discovery may pave the future for a new form of clean and sustainable energy.
What is Nuclear Fusion?
Nuclear fusion powers the Sun and the stars, where immense forces compress and heat hydrogen plasma to about 100 million degrees Celsius. At this temperature, the lighter particles fuse into helium, releasing enormous amounts of energy.
Nuclear fusion is a fairly clean energy source as it does not produce harmful atmospheric emissions and only produces a small amount of short-lived radioactive waste.
Scientists have been trying to replicate it on Earth for almost 70 years, using isotopes of hydrogen—deuterium and tritium—to power fusion plants.
Since deuterium is found in seawater and tritium is attained through irradiating lithium (a common element used in batteries), the accessibility of these isotopes means that fusion could become a major source of energy in the future.
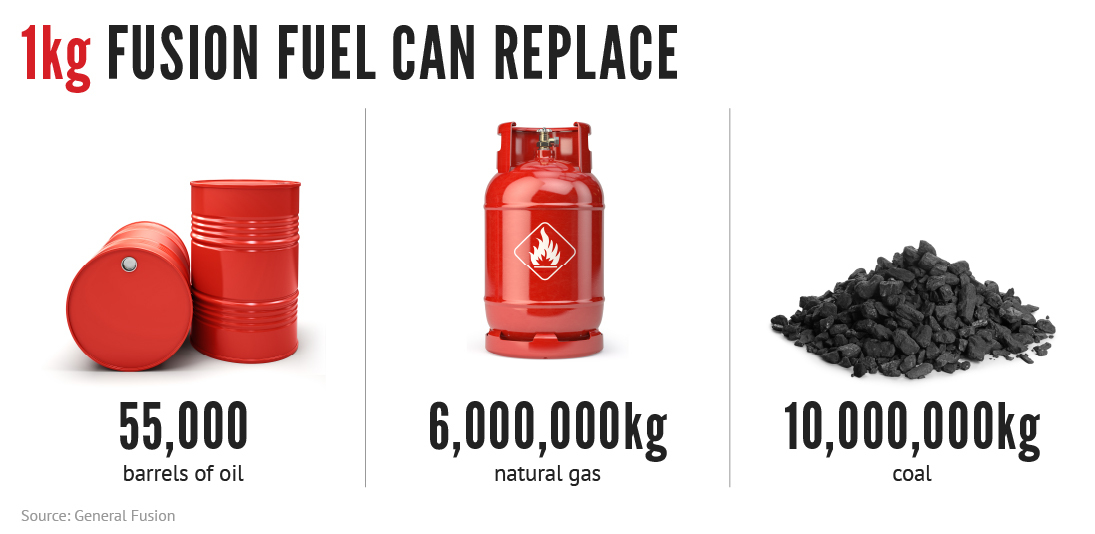
The amount of deuterium present in one liter of water, for example, could produce as much fusion energy as the combustion of 300 liters of oil.
However, the real challenge is ensuring fusion power plants generate more energy than they consume.
The Challenge of Fusion Ignition
Fusion ignition is the term for a fusion reaction that becomes self-sustaining, in which the reaction creates more energy than it uses up. Up until now, scientists were only able to break even.
The National Ignition Facility used a special setup called inertial confinement fusion that involves bombarding a tiny pellet of hydrogen plasma with lasers to achieve fusion ignition.
LLNL’s experiment surpassed the fusion threshold by delivering 2.05 megajoules (MJ) of energy to the target, resulting in 3.15 MJ of fusion energy output, according to the U.S. Department of Energy.
Can Nuclear Fusion Energy Be Commercialized Soon?
In recent years, fusion technology has been attracting the attention of governments as well as private companies such as Chevron and Google. Bloomberg Intelligence estimates that the fusion market will eventually be worth $40 trillion.
Besides energy generation, fusion is expected to be used in other markets like space propulsion, marine propulsion, and medical and industrial heat.
However, according to the director of the Lawrence Livermore National Laboratory, Kim Budil, it will take “probably decades” before nuclear fusion energy is commercialized.
During the breakthrough announcement, she noted that it was necessary to produce “many many fusion ignition events per minute” as well as have a “robust system of drivers” before fusion can be commercialized successfully.


Energy Shift
The World’s Biggest Oil Producers in 2023
Just three countries accounted for 40% of global oil production last year.

The World’s Biggest Oil Producers in 2023
This was originally posted on our Voronoi app. Download the app for free on iOS or Android and discover incredible data-driven charts from a variety of trusted sources.
Despite efforts to decarbonize the global economy, oil still remains one of the world’s most important resources. It’s also produced by a fairly limited group of countries, which can be a source of economic and political leverage.
This graphic illustrates global crude oil production in 2023, measured in million barrels per day, sourced from the U.S. Energy Information Administration (EIA).
Three Countries Account for 40% of Global Oil Production
In 2023, the United States, Russia, and Saudi Arabia collectively contributed 32.7 million barrels per day to global oil production.
| Oil Production 2023 | Million barrels per day |
|---|---|
| 🇺🇸 U.S. | 12.9 |
| 🇷🇺 Russia | 10.1 |
| 🇸🇦 Saudi Arabia | 9.7 |
| 🇨🇦 Canada | 4.6 |
| 🇮🇶 Iraq | 4.3 |
| 🇨🇳 China | 4.2 |
| 🇮🇷 Iran | 3.6 |
| 🇧🇷 Brazil | 3.4 |
| 🇦🇪 UAE | 3.4 |
| 🇰🇼 Kuwait | 2.7 |
| 🌍 Other | 22.8 |
These three nations have consistently dominated oil production since 1971. The leading position, however, has alternated among them over the past five decades.
In contrast, the combined production of the next three largest producers—Canada, Iraq, and China—reached 13.1 million barrels per day in 2023, just surpassing the production of the United States alone.
In the near term, no country is likely to surpass the record production achieved by the U.S. in 2023, as no other producer has ever reached a daily capacity of 13.0 million barrels. Recently, Saudi Arabia’s state-owned Saudi Aramco scrapped plans to increase production capacity to 13.0 million barrels per day by 2027.
In 2024, analysts forecast that the U.S. will maintain its position as the top oil producer. In fact, according to Macquarie Group, U.S. oil production is expected to achieve a record pace of about 14 million barrels per day by the end of the year.
Energy Shift
How Much Does the U.S. Depend on Russian Uranium?
Despite a new uranium ban being discussed in Congress, the U.S. is still heavily dependent on Russian uranium.

How Much Does the U.S. Depend on Russian Uranium?
This was originally posted on our Voronoi app. Download the app for free on iOS or Android and discover incredible data-driven charts from a variety of trusted sources.
The U.S. House of Representatives recently passed a ban on imports of Russian uranium. The bill must pass the Senate before becoming law.
In this graphic, we visualize how much the U.S. relies on Russian uranium, based on data from the United States Energy Information Administration (EIA).
U.S. Suppliers of Enriched Uranium
After Russia invaded Ukraine, the U.S. imposed sanctions on Russian-produced oil and gas—yet Russian-enriched uranium is still being imported.
Currently, Russia is the largest foreign supplier of nuclear power fuel to the United States. In 2022, Russia supplied almost a quarter of the enriched uranium used to fuel America’s fleet of more than 90 commercial reactors.
| Country of enrichment service | SWU* | % |
|---|---|---|
| 🇺🇸 United States | 3,876 | 27.34% |
| 🇷🇺 Russia | 3,409 | 24.04% |
| 🇩🇪 Germany | 1,763 | 12.40% |
| 🇬🇧 United Kingdom | 1,593 | 11.23% |
| 🇳🇱 Netherlands | 1,303 | 9.20% |
| Other | 2,232 | 15.79% |
| Total | 14,176 | 100% |
SWU stands for “Separative Work Unit” in the uranium industry. It is a measure of the amount of work required to separate isotopes of uranium during the enrichment process. Source: U.S. Energy Information Administration
Most of the remaining uranium is imported from European countries, while another portion is produced by a British-Dutch-German consortium operating in the United States called Urenco.
Similarly, nearly a dozen countries around the world depend on Russia for more than half of their enriched uranium—and many of them are NATO-allied members and allies of Ukraine.
In 2023 alone, the U.S. nuclear industry paid over $800 million to Russia’s state-owned nuclear energy corporation, Rosatom, and its fuel subsidiaries.
It is important to note that 19% of electricity in the U.S. is powered by nuclear plants.
The dependency on Russian fuels dates back to the 1990s when the United States turned away from its own enrichment capabilities in favor of using down-blended stocks of Soviet-era weapons-grade uranium.
As part of the new uranium-ban bill, the Biden administration plans to allocate $2.2 billion for the expansion of uranium enrichment facilities in the United States.

-

 Electrification3 years ago
Ranked: The Top 10 EV Battery Manufacturers
-

 Electrification2 years ago
The Key Minerals in an EV Battery
-

 Real Assets3 years ago
The World’s Top 10 Gold Mining Companies
-

 Misc3 years ago
All the Metals We Mined in One Visualization
-

 Electrification3 years ago
The Biggest Mining Companies in the World in 2021
-

 Energy Shift2 years ago
What Are the Five Major Types of Renewable Energy?
-

 Electrification2 years ago
The World’s Largest Nickel Mining Companies
-

 Electrification2 years ago
Mapped: Solar Power by Country in 2021