

Electrification
Ranked: The Top 10 EV Battery Manufacturers
Ranked: The Top 10 EV Battery Manufacturers
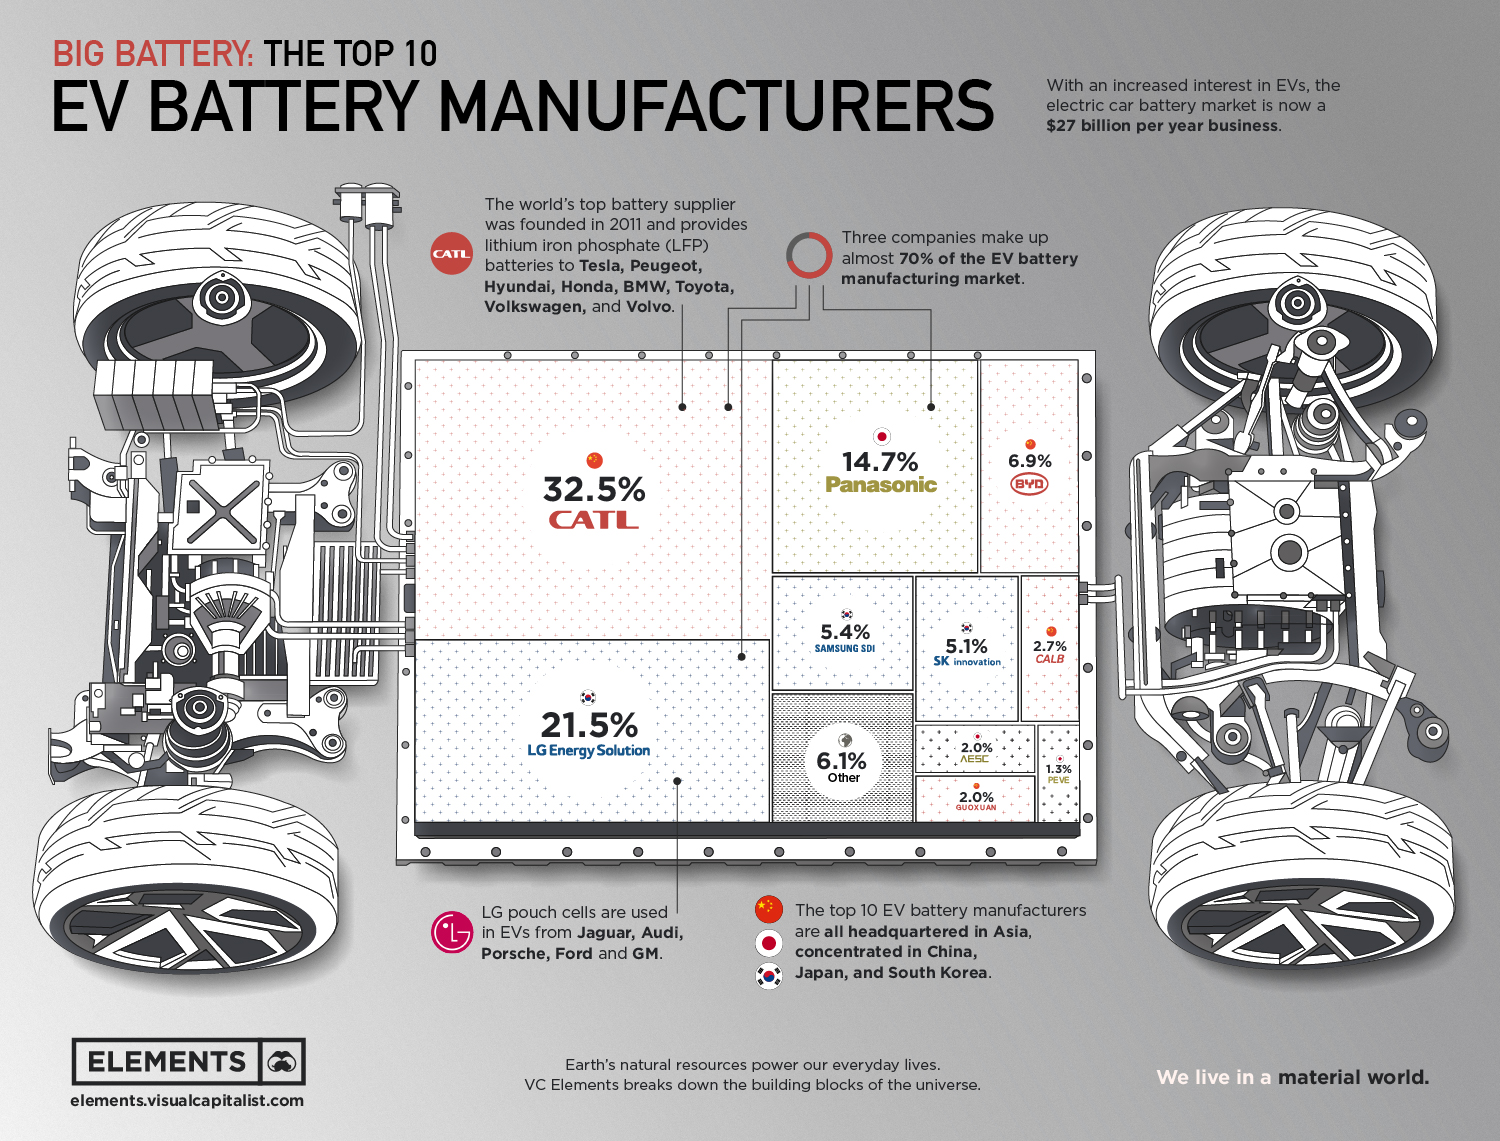
With increasing interest in electric vehicles (EVs) from consumers, the market for lithium-ion EV batteries is now a $27 billion per year business.
According to industry experts, high demand has boosted battery manufacturers’ profits and brought heavy competition to the market. And by 2027, the market could further grow to $127 billion as consumers embrace more affordable EVs.
Asian Powerhouses of Battery Production
Besides being a manufacturing powerhouse of vehicle parts, Asia is fast becoming a hotbed for innovation in the battery sector.
No wonder, the top 10 EV battery manufacturers by market share are all headquartered in Asian countries, concentrated in China, Japan, and South Korea.
| Rank | Company | 2021 Market Share | Country |
|---|---|---|---|
| #1 | CATL | 32.5% | China 🇨🇳 |
| #2 | LG Energy Solution | 21.5% | Korea 🇰🇷 |
| #3 | Panasonic | 14.7% | Japan 🇯🇵 |
| #4 | BYD | 6.9% | China 🇨🇳 |
| #5 | Samsung SDI | 5.4% | Korea 🇰🇷 |
| #6 | SK Innovation | 5.1% | Korea 🇰🇷 |
| #7 | CALB | 2.7% | China 🇨🇳 |
| #8 | AESC | 2.0% | Japan 🇯🇵 |
| #9 | Guoxuan | 2.0% | China 🇨🇳 |
| #10 | PEVE | 1.3% | Japan 🇯🇵 |
| n/a | Other | 6.1% | ROW |
According to data from SNE Research, the top three battery makers—CATL, LG, and, Panasonic—combine for nearly 70% of the EV battery manufacturing market.
Chinese Dominance
Based in China’s coastal city of Ningde, best known for its tea plantations, Contemporary Amperex Technology Co. Limited (CATL) has risen in less than 10 years to become the biggest global battery group.
The Chinese company provides lithium iron phosphate (LFP) batteries to Tesla, Peugeot, Hyundai, Honda, BMW, Toyota, Volkswagen, and Volvo, and shares in the company gained 160% in 2020, lifting CATL’s market capitalization to almost $186 billion.
CATL counts nine people on the Forbes list of global billionaires. Its founder, Zeng Yuqun, born in a poor village in 1968 during the Chinese Cultural Revolution, is now worth almost as much as Alibaba founder Jack Ma.
China also hosts the fourth biggest battery manufacturer, Warren Buffett-backed BYD.
Competition for CATL Outside China
Outside China, CATL faces tough competition from established players LG and Panasonic, respectively second and third on our ranking.
With more than 100 years of history, Panasonic has Tesla and Toyota among its battery buyers. LG pouch cells are used in EVs from Jaguar, Audi, Porsche, Ford, and GM.
U.S. and Europe’s Plans for Battery Production
President Joe Biden’s strategy to make the United States a powerhouse in electric vehicles includes boosting domestic production of batteries. European countries are also looking to reduce decades of growing reliance on China.
As Western countries speed up, new players are expected to rise.
A host of next-generation battery technologies are already being developed by U.S. companies, including Ionic Materials, QuantumScape, Sila Nanotechnologies, Sion Power, and, Sionic Energy.
Any direction the market moves, certainly the forecast is bright for battery producers.


Electrification
White Gold: Mapping U.S. Lithium Mines
In this graphic, Visual Capitalist partnerered with EnergyX to explore the size and location of U.S. lithium mines.

White Gold: Mapping U.S. Lithium Mines
The U.S. doubled imports of lithium-ion batteries for the third consecutive year in 2022, and with EV demand growing yearly, U.S. lithium mines must ramp up production or rely on other nations for their supply of refined lithium.
To determine if the domestic U.S. lithium opportunity can meet demand, we partnered with EnergyX to determine how much lithium sits within U.S. borders.
U.S. Lithium Projects
The most crucial measure of a lithium mine’s potential is the quantity that can be extracted from the source.
For each lithium resource, the potential volume of lithium carbonate equivalent (LCE) was calculated with a ratio of one metric ton of lithium producing 5.32 metric tons of LCE. Cumulatively, existing U.S. lithium projects contain 94.8 million metric tons of LCE.
| Rank | Project Name | LCE, million metric tons (est.) |
|---|---|---|
| 1 | McDermitt Caldera | 21.5 |
| 2 | Thacker Pass | 19.1 |
| 3 | Tonopah Flats | 18.0 |
| 4 | TLC Lithium | 10.7 |
| 5 | Clayton Valley (Century Lithium) | 6.3 |
| 6 | Zeus Lithium | 6.3 |
| 7 | Rhyolite Ridge | 3.4 |
| 8 | Arkansas Smackover (Phase 1A) | 2.8 |
| 9 | Basin Project | 2.2 |
| 10 | McGee Deposit | 2.1 |
| 11 | Arkansas Smackover (South West) | 1.8 |
| 12 | Clayton Valley (Lithium-X, Pure Energy) | 0.8 |
| 13 | Big Sandy | 0.3 |
| 14 | Imperial Valley/Salton Sea | 0.3 |
U.S. Lithium Opportunities, By State
U.S. lithium projects mainly exist in western states, with comparatively minor opportunities in central or eastern states.
| State | LCE, million metric tons (est.) |
|---|---|
| Nevada | 88.2 |
| Arkansas | 4.6 |
| Arizona | 2.5 |
| California | 0.3 |
Currently, the U.S. is sitting on a wealth of lithium that it is underutilizing. For context, in 2022, the U.S. only produced about 5,000 metric tons of LCE and imported a projected 19,000 metric tons of LCE, showing that the demand for the mineral is healthy.
The Next Gold Rush?
U.S. lithium companies have the opportunity to become global leaders in lithium production and accelerate the transition to sustainable energy sources. This is particularly important as the demand for lithium is increasing every year.
EnergyX is on a mission to meet U.S. lithium demands using groundbreaking technology that can extract 300% more lithium from a source than traditional methods.
You can take advantage of this opportunity by investing in EnergyX and joining other significant players like GM in becoming a shareholder.

Electrification
Will Direct Lithium Extraction Disrupt the $90B Lithium Market?
Visual Capitalist and EnergyX explore how direct lithium extraction could disrupt the $90B lithium industry.
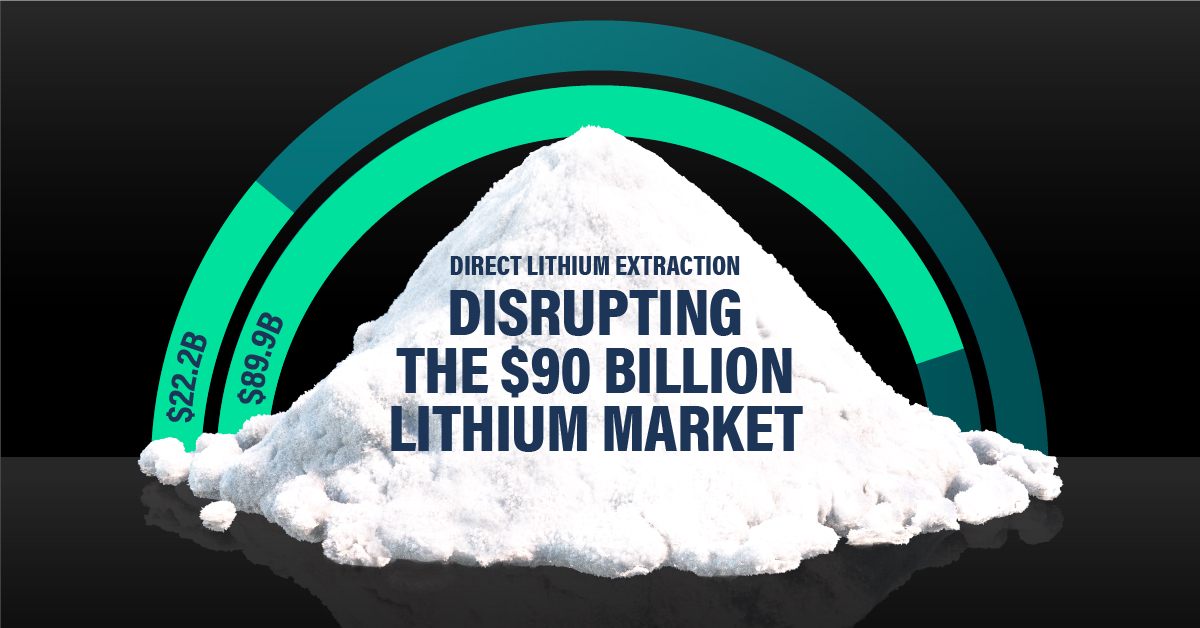
Will Direct Lithium Extraction Disrupt the $90B Lithium Market?
Current lithium extraction and refinement methods are outdated, often harmful to the environment, and ultimately inefficient. So much so that by 2030, lithium demand will outstrip supply by a projected 1.42 million metric tons. But there is a solution: Direct lithium extraction (DLE).
For this graphic, we partnered with EnergyX to try to understand how DLE could help meet global lithium demands and change an industry that is critical to the clean energy transition.
The Lithium Problem
Lithium is crucial to many renewable energy technologies because it is this element that allows EV batteries to react. In fact, it’s so important that projections show the lithium industry growing from $22.2B in 2023 to nearly $90B by 2030.
But even with this incredible growth, as you can see from the table, refined lithium production will need to increase 86.5% over and above current projections.
| 2022 (million metric tons) | 2030P (million metric tons) | |
|---|---|---|
| Lithium Carbonate Demand | 0.46 | 1.21 |
| Lithium Hydroxide Demand | 0.18 | 1.54 |
| Lithium Metal Demand | 0 | 0.22 |
| Lithium Mineral Demand | 0.07 | 0.09 |
| Total Demand | 0.71 | 3.06 |
| Total Supply | 0.75 | 1.64 |
The Solution: Direct Lithium Extraction
DLE is a process that uses a combination of solvent extraction, membranes, or adsorbents to extract and then refine lithium directly from its source. LiTASTM, the proprietary DLE technology developed by EnergyX, can recover an incredible 300% more lithium per ton than existing processes, making it the perfect tool to help meet lithium demands.
Additionally, LiTASTM can refine lithium at the lowest cost per unit volume directly from brine, an essential step in meeting tomorrow’s lithium demand and manufacturing next-generation batteries, while significantly reducing the footprint left by lithium mining.
| Hard Rock Mining | Underground Reservoirs | Direct Lithium Extraction | |
|---|---|---|---|
| Direct CO2 Emissions | 15,000 kg | 5,000 kg | 3.5 kg |
| Water Use | 170 m3 | 469 m3 | 34-94 m3 |
| Lithium Recovery Rate | 58% | 30-40% | 90% |
| Land Use | 464 m2 | 3124 m2 | 0.14 m2 |
| Process Time | Variable | 18 months | 1-2 days |
Providing the World with Lithium
DLE promises to disrupt the outdated lithium industry by improving lithium recovery rates and slashing emissions, helping the world meet the energy demands of tomorrow’s electric vehicles.
EnergyX is on a mission to become a worldwide leader in the sustainable energy transition using groundbreaking direct lithium extraction technology. Don’t miss your chance to join companies like GM and invest in EnergyX to transform the future of renewable energy.

-

 Electrification2 years ago
The Key Minerals in an EV Battery
-

 Real Assets2 years ago
The World’s Top 10 Gold Mining Companies
-

 Misc3 years ago
All the Metals We Mined in One Visualization
-

 Electrification3 years ago
The Biggest Mining Companies in the World in 2021
-

 Energy Shift2 years ago
What Are the Five Major Types of Renewable Energy?
-

 Electrification2 years ago
The World’s Largest Nickel Mining Companies
-

 Electrification2 years ago
Mapped: Solar Power by Country in 2021
-

 Electrification3 years ago
How Much Land is Needed to Power the U.S. with Solar?