

Misc
Ranked: The World’s Top Cotton Producers
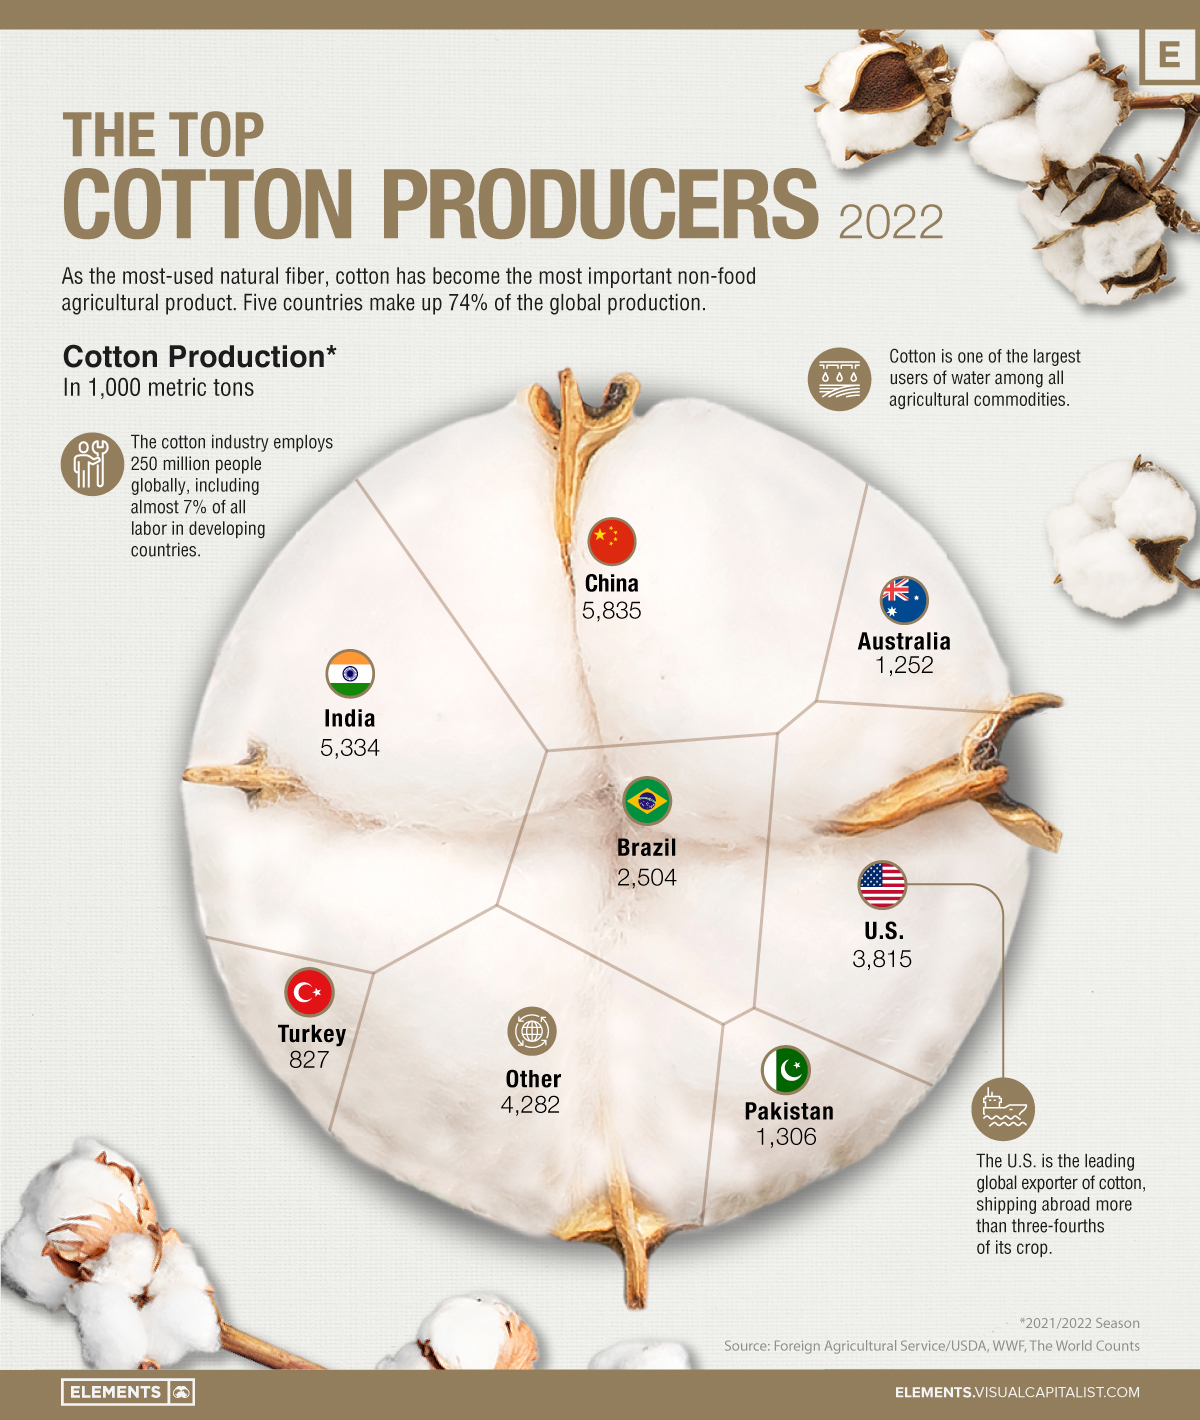


The Top Cotton Producers
Cotton is present in our everyday life, from clothes to coffee strainers, and more recently in masks to control the spread of COVID-19.
As the most-used natural fiber, cotton has become the most important non-food agricultural product. Currently, approximately half of all textiles require cotton fibers.
The above infographic lists the world’s top cotton producers, using data from the United States Department of Agriculture.
Fancy Fabric
Originating from the Arabic word “quton,” meaning fancy fabric, cotton is a staple fiber made up of short fibers twisted together to form yarn.
The earliest production of cotton was around 5,000 B.C. in India, and today, around 25 million tons of cotton are produced each year.
Currently, five countries make up around 75% of global cotton production, with China being the world’s biggest producer. The country is responsible for over 23% of global production, with approximately 89 million cotton farmers and part-time workers. Cotton’s importance cannot be understated, as it is the primary input for the Chinese textile industry along with many other nations’ textile industries.
| Top Cotton Producers | 2020/2021 (metric tons) | 2021/2022 (metric tons) |
|---|---|---|
| 🇨🇳 China | 6,445,000 | 5,835,000 |
| 🇮🇳 India | 6,009,000 | 5,334,000 |
| 🇺🇸 United States | 3,181,000 | 3,815,000 |
| 🇧🇷 Brazil | 2,356,000 | 2,504,000 |
| 🇦🇺 Australia | 610,000 | 1,252,000 |
| 🇵🇰 Pakistan | 980,000 | 1,306,000 |
| 🇹🇷 Turkey | 631,000 | 827,000 |
| 🌐 Other | 4,059,000 | 4,282,000 |
| Total | 24,271,000 | 25,155,000 |
The United States is the leading global exporter of cotton, exporting three-fourths of its crop with China as the top buyer.
Despite its importance for the global economy, cotton production faces significant sustainability challenges.
The Controversy Over Cotton
Cotton is one of the largest users of water among all agricultural commodities, and production often involves applying pesticides that threaten soil and water quality.
Along with this, production often involves forced and child labor. According to the European Commission, child labor in the cotton supply chain is most common in Africa and Asia, where it comes from small-holder farmers.
In 2020, U.S. apparel maker Patagonia stopped sourcing cotton from the autonomous territory of Xinjiang because of reports about forced labor and other human rights abuses against Uighurs and other ethnic minorities.
L Brands, the parent company of Victoria’s Secret, has also committed to eliminating Chinese cotton from its supply chain. Whether these changes in supply chains impact China’s cotton production and its practices, cotton remains essential to materials found across our daily lives.


Misc
Brass Rods: The Secure Choice
This graphic shows why brass rods are the secure choice for precision-machined and forged parts.

Brass Rods: The Secure Choice
The unique combination of machinability and recyclability makes brass rods the secure choice for manufacturers seeking future-proof raw material solutions.
This infographic, from the Copper Development Association, shows three ways brass rods give manufacturers greater control and a license to grow in the competitive market for precision-machined and forged products.
Future-Proof Investments in New Machine Tools
A material’s machinability directly impacts machine throughput, which typically has the largest impact on machine shop profitability.
The high-speed machining capabilities of brass rods maximize machine tool performance, allowing manufacturers to run the material faster and longer without sacrificing tool life, chip formation, or surface quality.
The high machining efficiency of brass leads to reduced per-part costs, quicker return on investment (ROI) for new machine tools, and expanded production capacity for new projects.
Supply Security Through Closed Loop Recycling
Brass, like its parent element copper, can be infinitely recycled.
In 2022, brass- and wire-rod mills accounted for the majority of the 830,000 tonnes of copper recycled from scrap in the U.S.
Given that scrap ratios for machined parts typically range from 60-70% by weight, producing mills benefit from a secure and steady supply of clean scrap returned directly from customers, which is recycled to create new brass rods.
The high residual value of brass scrap creates a strong recycling incentive. Scrap buy back programs give manufacturers greater control over raw material net costs as scrap value is often factored into supplier purchase agreements.
Next Generation Alloys for a Lead-Free Future
Increasingly stringent global regulations continue to pressure manufacturers to minimize the use of materials containing trace amounts of lead and other harmful impurities.
The latest generation of brass-rod alloys is engineered to meet the most demanding criteria for lead leaching in drinking water and other sensitive applications.
Seven brass-rod alloys passed rigorous testing to become the only ‘Acceptable Materials’ against lower lead leaching criteria recently adopted in the national U.S. drinking water quality standard, NSF 61.
Learn more about the advantages of brass rods solutions.
Misc
Brass Rods: The Safe Choice
From airbags to firefighting equipment, components made from brass rods play a vital role in creating a safer environment.

Brass Rods: The Safe Choice
From airbags to firefighting equipment, components made from brass rods play a vital role in creating a safer environment.
This infographic from the Copper Development Association illustrates three use cases for brass. This is the first of three infographics in our Choose Brass series.
Why Brass?
Brass is one of the most reliable metals for industrial and other applications. It contains little to no iron, protecting it from oxidation, which can cause other materials to fail over time.
Additionally, the malleability of brass ensures tight and leak-free metal-to-metal seals for threaded joints, minimizing the risk of costly and dangerous system failures. Brass’s durability ensures critical system components function properly for years.
Brass for Safe Water Systems
Exposure to lead in water can cause various health problems, including neurological damage, developmental delays, and cardiovascular diseases.
As a result, the U.S. sets minimum health-effect requirements for chemical contaminants and impurities indirectly transferred to drinking water from products, components, and materials used in water systems.
Currently, only brass rod alloys are designated as “acceptable materials” according to national standards.
Brass is also essential for ensuring workplace safety, particularly in high-risk manufacturing environments.
Using Brass for Safe Manufacturing and Industrial Environments
Brass is used extensively in industrial applications such as machinery components, valves, fittings, architectural elements, bearings, and gears.
The machinability of brass rods also means longer tool life and higher productivity for manufacturers of precision parts.
The microstructure of brass helps break up metal chips generated during machining operations, preventing long and stringy chips that can crash machines and seriously injure operators.
Additionally, brass’s non-sparking properties make it ideal for tooling, fittings, and components in high-risk industries such as oil & gas, chemicals, pharmaceuticals, paint manufacturing, power plants, and explosives.
Brass for Safer Communities
Many pieces of equipment in our daily lives also rely on brass rod parts to function. Control valves in gas stoves, BBQs, and home furnaces made from brass rods reduce the risk of deadly gas leaks and fires.
Moreover, brass is ideal for firefighting equipment due to its corrosion resistance, durability, heat resistance, and non-sparking properties.
Fittings made from brass rods ensure that the brakes and airbags in our vehicles work when needed.
Brass and other copper-based alloys are also naturally antimicrobial, helping prevent diseases when used in high-touch surfaces such as door handles.
These are only some of the ways that brass rods help build a safer world for everyone.
Explore the Advantages of Brass Rod Solutions.

-

 Electrification3 years ago
Ranked: The Top 10 EV Battery Manufacturers
-

 Electrification2 years ago
The Key Minerals in an EV Battery
-

 Real Assets3 years ago
The World’s Top 10 Gold Mining Companies
-

 Misc3 years ago
All the Metals We Mined in One Visualization
-

 Electrification3 years ago
The Biggest Mining Companies in the World in 2021
-

 Energy Shift2 years ago
What Are the Five Major Types of Renewable Energy?
-

 Electrification2 years ago
The World’s Largest Nickel Mining Companies
-

 Electrification2 years ago
Mapped: Solar Power by Country in 2021