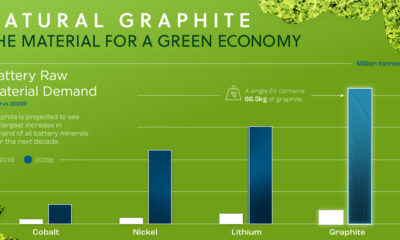

The demand for natural graphite is expected to increase by 1437% by 2030. This infographic highlights why.
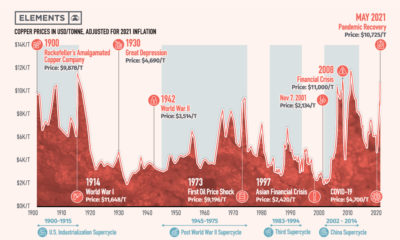

To put current copper price trends into perspective, this graphic shows the metal's previous rallies over the last 120 years.
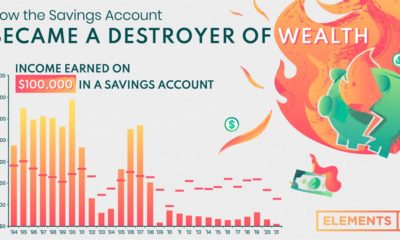

The interest income needed to beat inflation since 1994 has varied, but in the last 13 years, savings accounts failed to live up to the task.
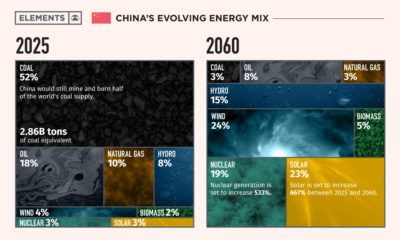

This infographic takes a look at what China's energy transition plans are to make its energy mix carbon neutral by 2060.
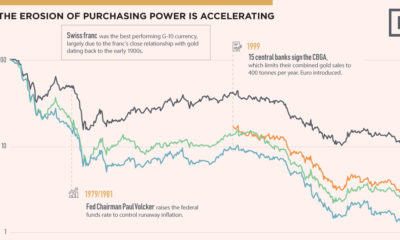

Over the last 40 years, the purchasing power of the world’s most popular currencies have declined against gold.
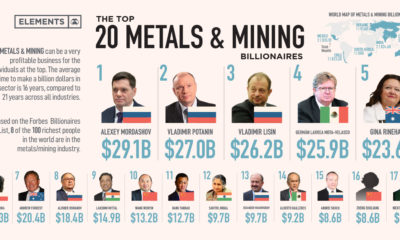

This infographic ranks the world's richest 20 metals and mining billionaires, based on the Forbes Billionaires List.
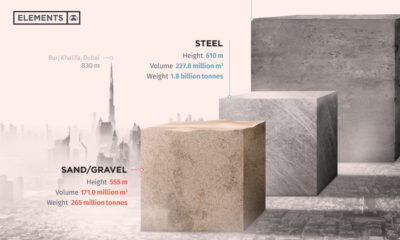

Humanity produces a staggering amount of sand, steel, and cement every year to build the cities and spaces we live in.
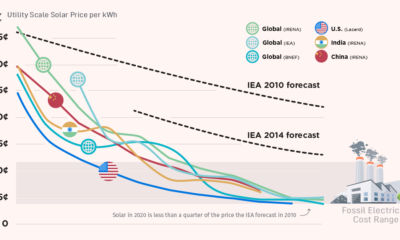

Wright's Law, a rule of thumb initially observed in the aircraft industry, helps us see why the cost of solar power has been underestimated.
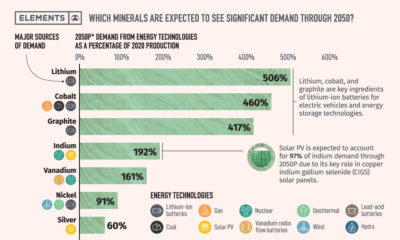

Energy technologies are often mineral-intensive. This chart shows how the energy shift is creating massive demand for minerals.
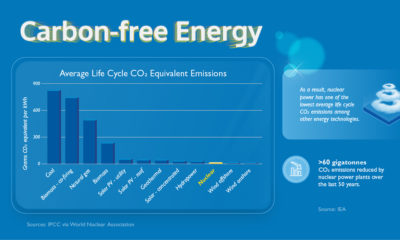

The advantages of nuclear energy make it a critical part of our energy mix. But how does it fit into the transition to clean energy?