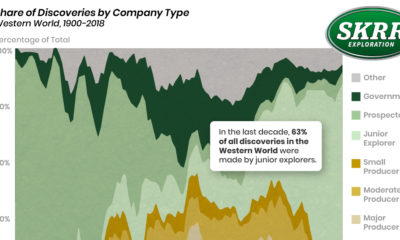

Visualizing the Genealogy of Exploration Success In the last decade, 63% of all mineral discoveries in the Western world were made by junior explorers. These small...


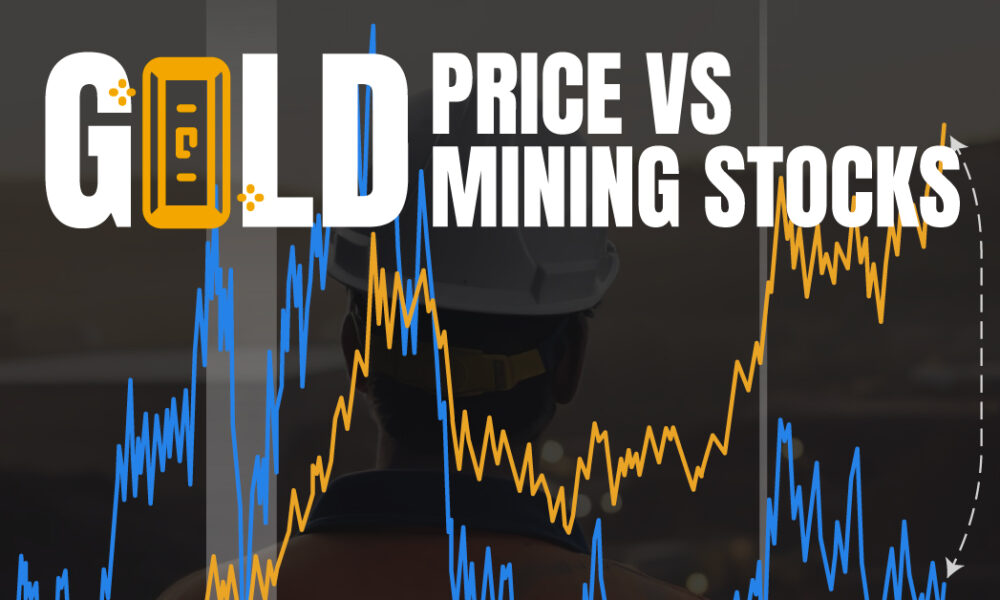
Together, the world’s top 10 gold mining companies account for roughly 22% of the share of the total gold market.


Where are the world's largest copper mines, and just how large are they? Here are the 20 largest copper mines by capacity.
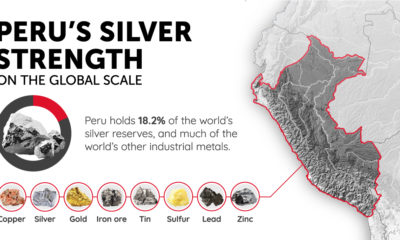

With a rich history of mining, Peru plays a vital role in supplying the world with silver for clean energy technologies and electrification.


From iron ore to gold, over 3 billion tonnes of metals were mined in 2019. Which metals did miners produce?


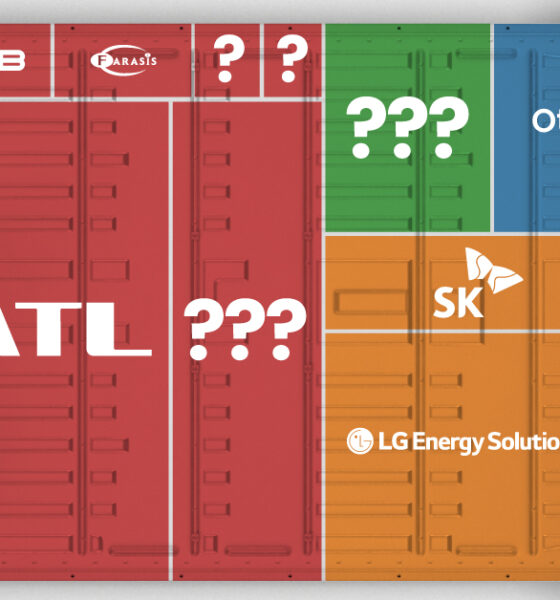
With an increasing interest in electric vehicles (EVs), the battery market is now a $27 billion per year business.
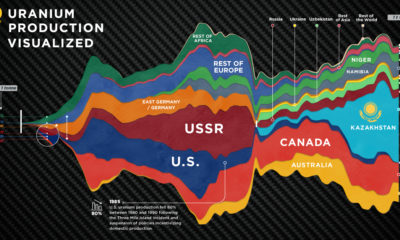

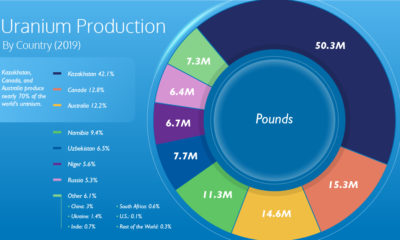
Global uranium production has been affected by world events throughout history. Here's how uranium production has evolved over 70 years.

The uranium market is at a tipping point. Here's how the forces of uranium supply and demand could change the direction of the industry.
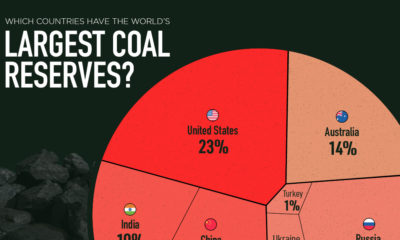

The world has 1 billion tonnes of coal reserves. Here are the 11 countries with at least a 1% share of global proven reserves.
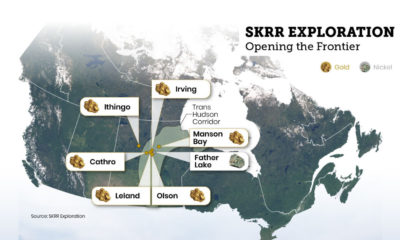

The Next Frontier: Mineral Exploration in Saskatchewan Lying in the heart of Canada is the next great mineral exploration frontier, Saskatchewan. This humble province lies at...