

Nickel has emerged as an important battery metal, and these ten nickel mining companies are producing the nickel needed for EV batteries.
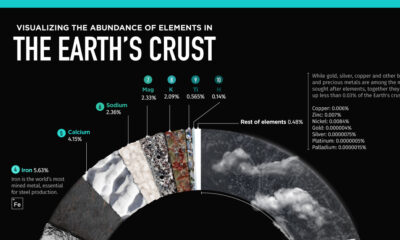

The Earth's crust makes up 1% of the planet's volume, but provides all the material we use. What elements make up this thin layer we stand...
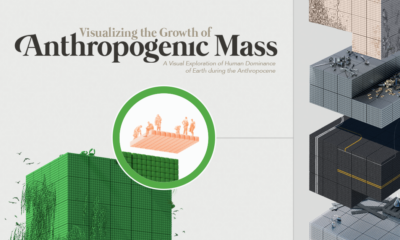

The amount of human-made (or anthropogenic) mass, has now exceeded the weight of all life on Earth, including humans, animals, and plants.
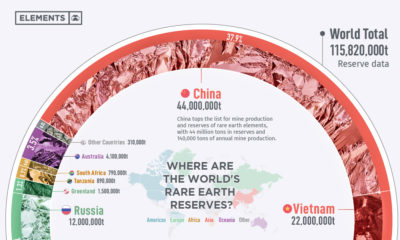

Rare earth elements are the critical ingredients for a greener economy, making their reserves increasingly valuable to global supply chains.
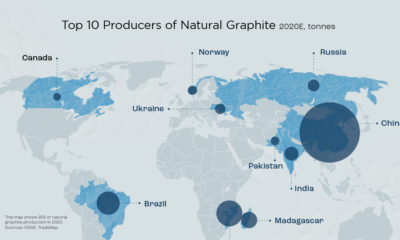

In 2020, China produced 59% of natural graphite and over 80% of battery anode material. Here's a look at the graphite supply problem.


In 2020, solar power saw its largest-ever annual capacity expansion at 127 gigawatts. Here's a snapshot of solar power capacity by country.
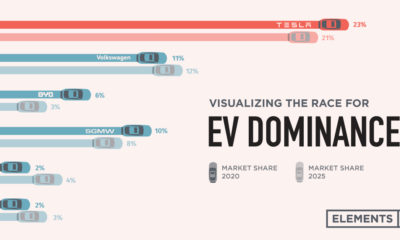

Tesla was the first automaker to hit a $1 trillion market cap, but other electric car companies have plans to unseat the dominant EV maker.
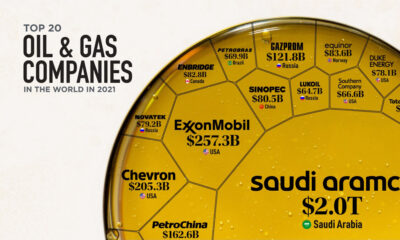

Oil still makes up the largest share of the global energy mix. Here are the largest oil and gas companies by market cap in 2021.
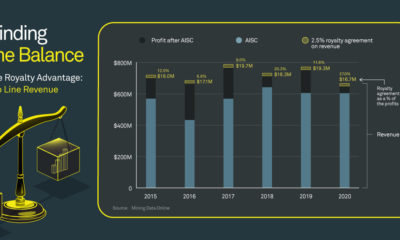

Royalty companies can flexibly manage risk more easily compared to mining companies, while still offering precious metals exposure.
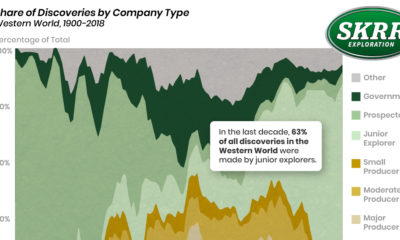

Visualizing the Genealogy of Exploration Success In the last decade, 63% of all mineral discoveries in the Western world were made by junior explorers. These small...