

Real Assets
Measuring the Level of Competition for Valuable Minerals
Measuring Competition for Valuable Minerals
The Chart of the Week is a weekly Visual Capitalist feature on Fridays.
Everybody loves a little competition.
It levels the playing field and ensures prices and products are kept affordable and available. But how do you measure and track the competitiveness of specific sectors?
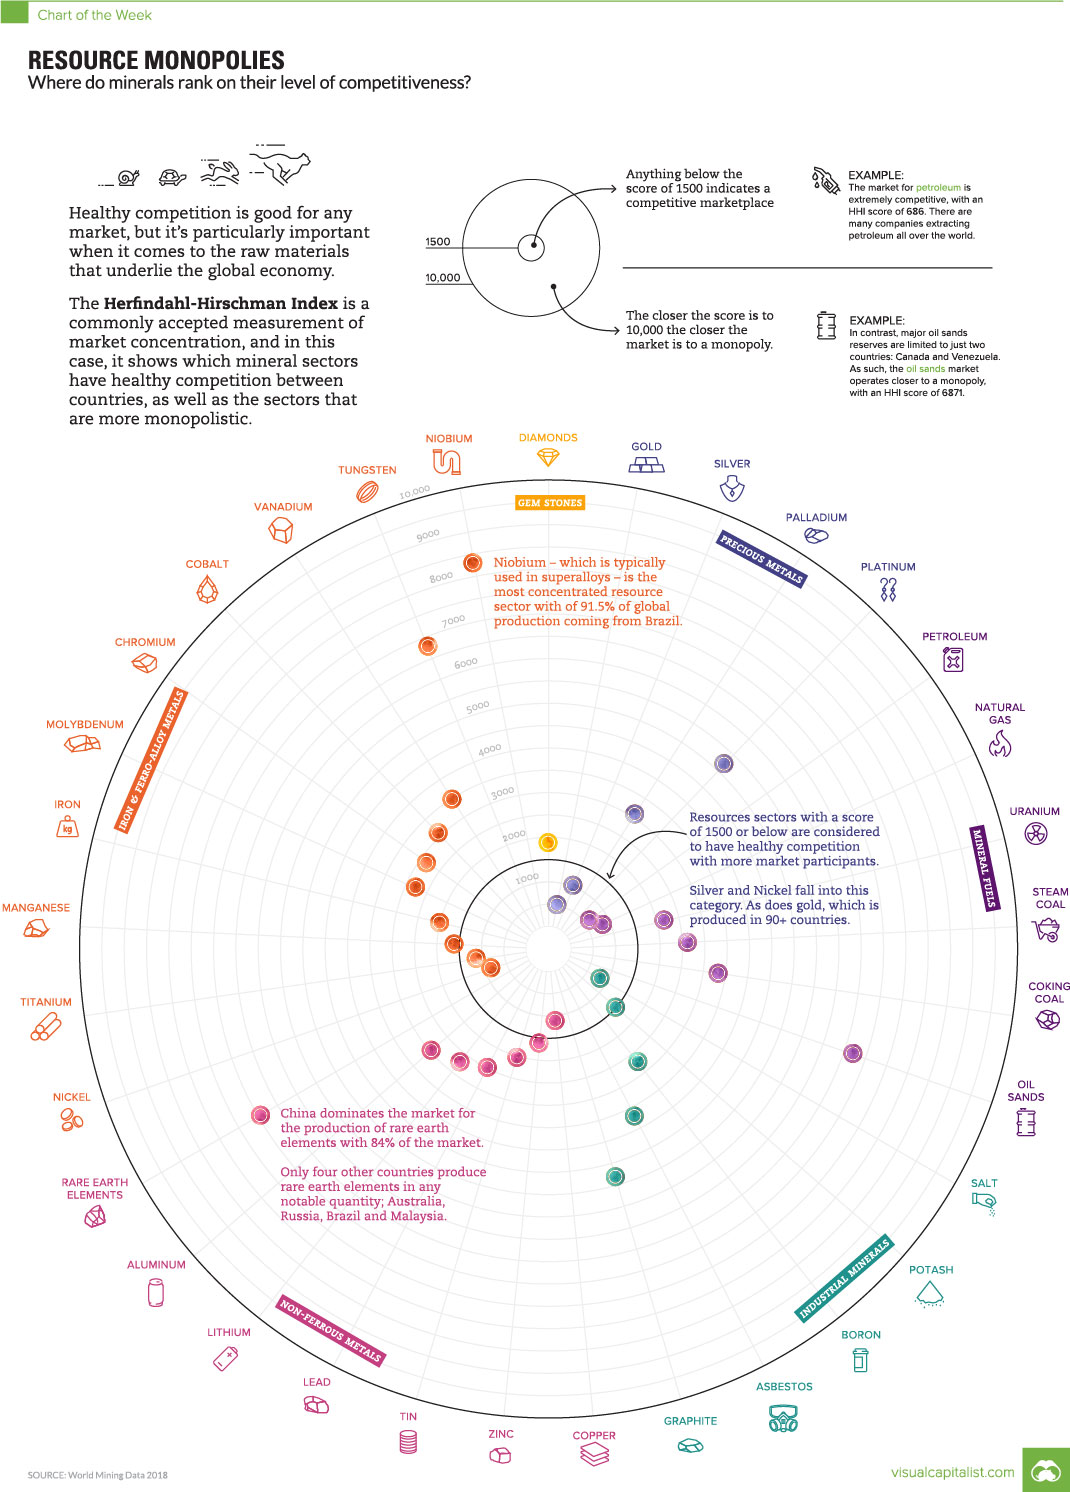
The Herfindahl-Hirschman Index (HHI) is a commonly accepted measurement of market concentration, and in today’s case, we use it to show which mineral sectors have healthy competition between countries, as well as the sectors that are more monopolistic.
What is the Herfindahl-Hirschman Index?
The HHI is calculated by squaring the market share of each competitor and then summing up the resulting numbers. It can range from zero to 10,000.
The closer a market is to a monopoly, the higher the market’s concentration, and the lower its competition. If there were only one company in an industry, that company would have a 100% share of the market, and the HHI would equal 10,000, demonstrating a monopoly.
Conversely, if there were thousands of firms competing, the HHI would be near zero, indicating almost perfect competition.
- HHI below 1,500: a competitive marketplace
- HHI between 1,500 – 2,500: a moderately concentrated marketplace
- HHI of 2,500 or greater: a highly concentrated marketplace
Interestingly, the same technique is also used by the U.S. Department of Justice to look at market competition and potential anti-trust violators, as well.
Global Metal Production
Today’s chart uses data from the World Mining Congress to look at the competition for global minerals between countries. The HHI scores show the minerals most and least exposed to competition, while uncovering opportunities for countries looking to bolster their own mineral production.
Here are 33 minerals ranked, going from highest score (most monopolistic) to lowest (least monopolistic):
| Rank | Mineral | HHI Score | Type of Mineral |
|---|---|---|---|
| #1 | Niobium (Nb2O5) | 8,413 | Iron and Ferro-Alloy Metals |
| #2 | REE (Rare Earth Elements) | 7,219 | Non-Ferrous Metals |
| #3 | Oil Sands | 6,871 | Mineral Fuels |
| #4 | Tungsten (W) | 6,828 | Iron and Ferro-Alloy Metals |
| #5 | Platinum (Pt) | 5,383 | Precious Metals |
| #6 | Graphite | 4,990 | Industrial Minerals |
| #7 | Asbestos | 3,738 | Industrial Minerals |
| #8 | Vanadium (V) | 3,573 | Iron and Ferro-Alloy Metals |
| #9 | Coking Coal | 3,423 | Mineral Fuels |
| #10 | Cobalt (Co) | 3,184 | Iron and Ferro-Alloy Metals |
| #11 | Palladium (Pd) | 3,163 | Precious Metals |
| #12 | Aluminum (Al) | 3,078 | Non-Ferrous Metals |
| #13 | Chromium (Cr2O3) | 2,942 | Iron and Ferro-Alloy Metals |
| #14 | Molybdenum (Mo) | 2,812 | Iron and Ferro-Alloy Metals |
| #15 | Boron (B) | 2,749 | Industrial Minerals |
| #16 | Lithium (Li2O) | 2,749 | Non-Ferrous Metals |
| #17 | Steam Coal | 2,639 | Mineral Fuels |
| #18 | Lead (Pb) | 2,505 | Non-Ferrous Metals |
| #19 | Uranium (U308) | 2,233 | Mineral Fuels |
| #20 | Tin (Sn) | 2,036 | Non-Ferrous Metals |
| #21 | Iron (Fe) | 2,015 | Iron and Ferro-Alloy Metals |
| #22 | Diamond | 1,904 | Gemstones |
| #23 | Zinc (Zn) | 1,687 | Non-Ferrous Metals |
| #24 | Manganese (Mn) | 1,627 | Iron and Ferro-Alloy Metals |
| #25 | Potash | 1,565 | Industrial Minerals |
| #26 | Copper (Cu) | 1,136 | Non-Ferrous Metals |
| #27 | Titanium (TIO2) | 1,120 | Iron and Ferro-Alloy Metals |
| #28 | Silver (Ag) | 1,015 | Precious Metals |
| #29 | Salt (NaCl) | 982 | Industrial Minerals |
| #30 | Nickel (Ni) | 949 | Iron and Ferro-Alloy Metals |
| #31 | Natural Gas | 884 | Mineral Fuels |
| #32 | Petroleum | 686 | Mineral Fuels |
| #33 | Gold (Au) | 557 | Precious Metals |
The data here makes it clear that mineral production is not uniformly distributed throughout the world, giving some countries huge advantages while revealing potential supply problems down the road.
Renewables in the Spotlight
While commodities like gold and oil have robust levels of competition around the world, the renewable energy industry relies on more obscure raw materials to make solar, wind, and EVs work.
Rare earth elements (REE) rank #2 on the list with a HHI score of 7,219, while battery minerals such as graphite (#6), vanadium (#8), cobalt (#10), and lithium (#16) also appear high on the list as well.
According to a recent study, the production of rare earth elements is an area of particular concern. Used in everything from electric motors to wind turbines, rare earth demand will need to increase by twelve times by 2050 to reach emissions targets set by the Paris Agreement.
The only problem is that China currently controls 84% of global production, which increases the odds of bottlenecks and scarcity as demand rises. This ultimately creates an interesting scenario, where a sustainable future will be at the mercy of a few a producing nations.


Real Assets
Charted: The Value Gap Between the Gold Price and Gold Miners
While gold prices hit all-time highs, gold mining stocks have lagged far behind.

Gold Price vs. Gold Mining Stocks
This was originally posted on our Voronoi app. Download the app for free on Apple or Android and discover incredible data-driven charts from a variety of trusted sources.
Although the price of gold has reached new record highs in 2024, gold miners are still far from their 2011 peaks.
In this graphic, we illustrate the evolution of gold prices since 2000 compared to the NYSE Arca Gold BUGS Index (HUI), which consists of the largest and most widely held public gold production companies. The data was compiled by Incrementum AG.
Mining Stocks Lag Far Behind
In April 2024, gold reached a new record high as Federal Reserve Chair Jerome Powell signaled policymakers may delay interest rate cuts until clearer signs of declining inflation materialize.
Additionally, with elections occurring in more than 60 countries in 2024 and ongoing conflicts in Ukraine and Gaza, central banks are continuing to buy gold to strengthen their reserves, creating momentum for the metal.
Traditionally known as a hedge against inflation and a safe haven during times of political and economic uncertainty, gold has climbed over 11% so far this year.
According to Business Insider, gold miners experienced their best performance in a year in March 2024. During that month, the gold mining sector outperformed all other U.S. industries, surpassing even the performance of semiconductor stocks.
Still, physical gold has outperformed shares of gold-mining companies over the past three years by one of the largest margins in decades.
| Year | Gold Price | NYSE Arca Gold BUGS Index (HUI) |
|---|---|---|
| 2023 | $2,062.92 | $243.31 |
| 2022 | $1,824.32 | $229.75 |
| 2021 | $1,828.60 | $258.87 |
| 2020 | $1,895.10 | $299.64 |
| 2019 | $1,523.00 | $241.94 |
| 2018 | $1,281.65 | $160.58 |
| 2017 | $1,296.50 | $192.31 |
| 2016 | $1,151.70 | $182.31 |
| 2015 | $1,060.20 | $111.18 |
| 2014 | $1,199.25 | $164.03 |
| 2013 | $1,201.50 | $197.70 |
| 2012 | $1,664.00 | $444.22 |
| 2011 | $1,574.50 | $498.73 |
| 2010 | $1,410.25 | $573.32 |
| 2009 | $1,104.00 | $429.91 |
| 2008 | $865.00 | $302.41 |
| 2007 | $836.50 | $409.37 |
| 2006 | $635.70 | $338.24 |
| 2005 | $513.00 | $276.90 |
| 2004 | $438.00 | $215.33 |
| 2003 | $417.25 | $242.93 |
| 2002 | $342.75 | $145.12 |
| 2001 | $276.50 | $65.20 |
| 2000 | $272.65 | $40.97 |
Among the largest companies on the NYSE Arca Gold BUGS Index, Colorado-based Newmont has experienced a 24% drop in its share price over the past year. Similarly, Canadian Barrick Gold also saw a decline of 6.5% over the past 12 months.
Real Assets
200 Years of Global Gold Production, by Country
Global gold production has grown exponentially since the 1800s, with 86% of all above-ground gold mined in the last 200 years.


Visualizing Global Gold Production Over 200 Years
Although the practice of gold mining has been around for thousands of years, it’s estimated that roughly 86% of all above-ground gold was extracted in the last 200 years.
With modern mining techniques making large-scale production possible, global gold production has grown exponentially since the 1800s.
The above infographic uses data from Our World in Data to visualize global gold production by country from 1820 to 2022, showing how gold mining has evolved to become increasingly global over time.
A Brief History of Gold Mining
The best-known gold rush in modern history occurred in California in 1848, when James Marshall discovered gold in Sacramento Valley. As word spread, thousands of migrants flocked to California in search of gold, and by 1855, miners had extracted around $2 billion worth of gold.
The United States, Australia, and Russia were (interchangeably) the three largest gold producers until the 1890s. Then, South Africa took the helm thanks to the massive discovery in the Witwatersrand Basin, now regarded today as one of the world’s greatest ever goldfields.
South Africa’s annual gold production peaked in 1970 at 1,002 tonnes—by far the largest amount of gold produced by any country in a year.
With the price of gold rising since the 1980s, global gold production has become increasingly widespread. By 2007, China was the world’s largest gold-producing nation, and today a significant quantity of gold is being mined in over 40 countries.
The Top Gold-Producing Countries in 2022
Around 31% of the world’s gold production in 2022 came from three countries—China, Russia, and Australia, with each producing over 300 tonnes of the precious metal.
| Rank | Country | 2022E Gold Production, tonnes | % of Total |
|---|---|---|---|
| #1 | 🇨🇳 China | 330 | 11% |
| #2 | 🇷🇺 Russia | 320 | 10% |
| #3 | 🇦🇺 Australia | 320 | 10% |
| #4 | 🇨🇦 Canada | 220 | 7% |
| #5 | 🇺🇸 United States | 170 | 5% |
| #6 | 🇲🇽 Mexico | 120 | 4% |
| #7 | 🇰🇿 Kazakhstan | 120 | 4% |
| #8 | 🇿🇦 South Africa | 110 | 4% |
| #9 | 🇵🇪 Peru | 100 | 3% |
| #10 | 🇺🇿 Uzbekistan | 100 | 3% |
| #11 | 🇬🇭 Ghana | 90 | 3% |
| #12 | 🇮🇩 Indonesia | 70 | 2% |
| - | 🌍 Rest of the World | 1,030 | 33% |
| - | World Total | 3,100 | 100% |
North American countries Canada, the U.S., and Mexico round out the top six gold producers, collectively making up 16% of the global total. The state of Nevada alone accounted for 72% of U.S. production, hosting the world’s largest gold mining complex (including six mines) owned by Nevada Gold Mines.
Meanwhile, South Africa produced 110 tonnes of gold in 2022, down by 74% relative to its output of 430 tonnes in 2000. This long-term decline is the result of mine closures, maturing assets, and industrial conflict, according to the World Gold Council.
Interestingly, two smaller gold producers on the list, Uzbekistan and Indonesia, host the second and third-largest gold mining operations in the world, respectively.
The Outlook for Global Gold Production
As of April 25, gold prices were hovering around the $2,000 per ounce mark and nearing all-time highs. For mining companies, higher gold prices can mean more profits per ounce if costs remain unaffected.
According to the World Gold Council, mined gold production is expected to increase in 2023 and could surpass the record set in 2018 (3,300 tonnes), led by the expansion of existing projects in North America. The chances of record mine output could be higher if gold prices continue to increase.

-

 Electrification3 years ago
Ranked: The Top 10 EV Battery Manufacturers
-

 Electrification2 years ago
The Key Minerals in an EV Battery
-

 Real Assets3 years ago
The World’s Top 10 Gold Mining Companies
-

 Misc3 years ago
All the Metals We Mined in One Visualization
-

 Electrification3 years ago
The Biggest Mining Companies in the World in 2021
-

 Energy Shift2 years ago
What Are the Five Major Types of Renewable Energy?
-

 Electrification2 years ago
Mapped: Solar Power by Country in 2021
-

 Electrification2 years ago
The World’s Largest Nickel Mining Companies