

Energy Shift
Visualizing China’s Dominance in the Solar Panel Supply Chain


China’s Dominance in the Solar Panel Supply Chain
Many governments are investing in renewable energy sources like solar power, but who controls the manufacturing of solar photovoltaic (PV) panels?
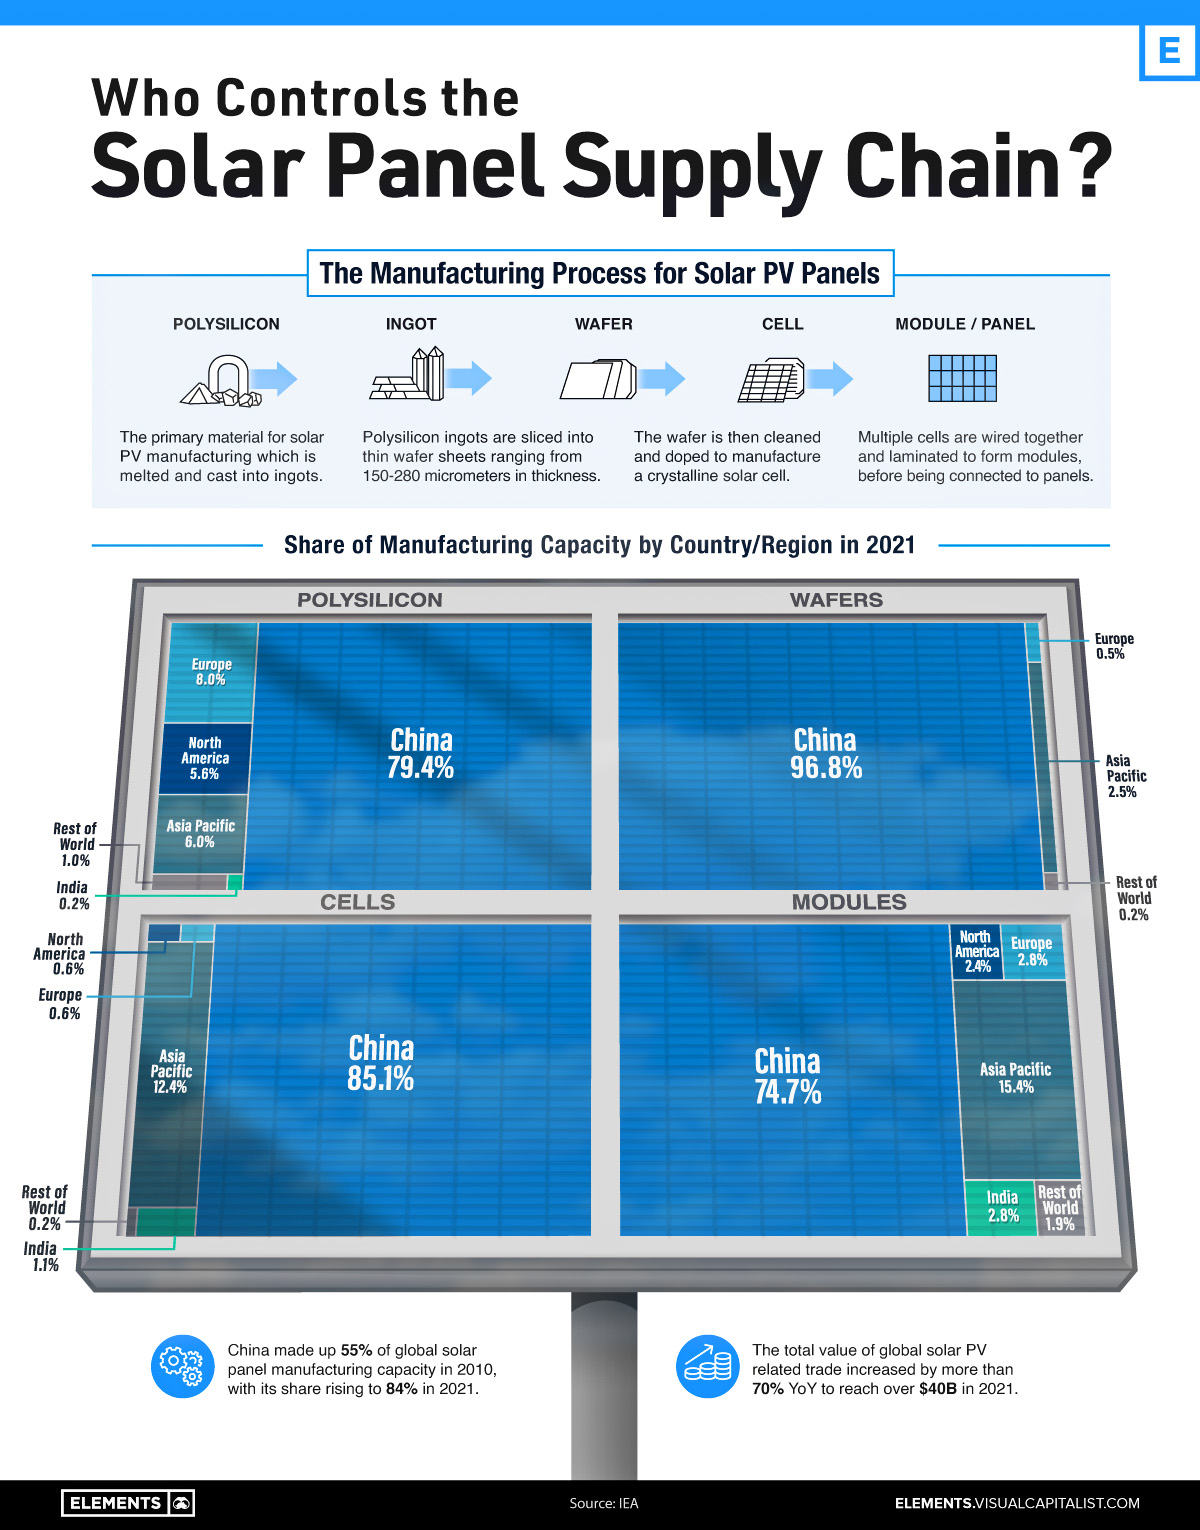
As it turns out, China owns the vast majority of the world’s solar panel supply chain, controlling at least 75% of every single key stage of solar photovoltaic panel manufacturing and processing.
This visualization shows the shares held by different countries and regions of the key stages of solar panel manufacturing, using data from the International Energy Agency (IEA).
Solar Panel Manufacturing, by Country and Stage
From polysilicon production to soldering finished solar cells and modules onto panels, China has the largest share in every stage of solar panel manufacturing.
Even back in 2010, the country made the majority of the world’s solar panels, but over the past 12 years, its average share of the solar panel supply chain has gone from 55% to 84%.
China also continues to lead in terms of investment, making up almost two-thirds of global large-scale solar investment. In the first half of 2022, the country invested $41 billion, a 173% increase from the year before.
| Country/Region | Solar Panel Demand | Average Share of Solar Panel Manufacturing Capacity |
|---|---|---|
| China | 36.4% | 84.0% |
| Europe | 16.8% | 2.9% |
| North America | 17.6% | 2.8% |
| Asia-Pacific | 13.2% | 9.1% |
| India | 6.9% | 1.3% |
| Rest of the World | 9.1% | 0.8% |
Source: IEA
Note: Percentages may not add up to 100% due to rounding
After China, the next leading nation in solar panel manufacturing is India, which makes up almost 3% of solar module manufacturing and 1% of cell manufacturing. To help meet the country’s goal of 280 gigawatts (GW) of installed solar power capacity by 2030 (currently 57.9 GW), in 2022 the Indian government allocated an additional $2.6 billion to its production-linked incentive scheme that supports domestic solar PV panel manufacturing.
Alongside China and India, the Asia-Pacific region also makes up significant amounts of solar panel manufacturing, especially modules and cells at 15.4% and 12.4% respectively.
While Europe and North America make up more than one-third of the global demand for solar panels, both regions make up an average of just under 3% each across all stages of actually manufacturing solar panels.
Too Little Too Late to Diversify?
China’s dominance of solar photovoltaic panel manufacturing is not the only stranglehold the country has on renewable energy infrastructure and materials.
When it comes to wind, in 2021 China built more offshore wind turbines than all other countries combined over the past five years, and the country is also the leading producer and processor of the rare earth minerals essential for the magnets that power turbine generators.
In its full report on solar panel manufacturing, the IEA emphasized the importance of distributing global solar panel manufacturing capacity. Recent unexpected manufacturing halts in China have resulted in the price of polysilicon rising to 10-year highs, revealing the world’s dependence on China for the supply of key materials.
As the world builds out its solar and wind energy capacity, will it manage to avoid repeating Europe’s mistakes of energy import overdependence when it comes to the materials and manufacturing of renewable energy infrastructure?


Energy Shift
The World’s Biggest Oil Producers in 2023
Just three countries accounted for 40% of global oil production last year.

The World’s Biggest Oil Producers in 2023
This was originally posted on our Voronoi app. Download the app for free on iOS or Android and discover incredible data-driven charts from a variety of trusted sources.
Despite efforts to decarbonize the global economy, oil still remains one of the world’s most important resources. It’s also produced by a fairly limited group of countries, which can be a source of economic and political leverage.
This graphic illustrates global crude oil production in 2023, measured in million barrels per day, sourced from the U.S. Energy Information Administration (EIA).
Three Countries Account for 40% of Global Oil Production
In 2023, the United States, Russia, and Saudi Arabia collectively contributed 32.7 million barrels per day to global oil production.
| Oil Production 2023 | Million barrels per day |
|---|---|
| 🇺🇸 U.S. | 12.9 |
| 🇷🇺 Russia | 10.1 |
| 🇸🇦 Saudi Arabia | 9.7 |
| 🇨🇦 Canada | 4.6 |
| 🇮🇶 Iraq | 4.3 |
| 🇨🇳 China | 4.2 |
| 🇮🇷 Iran | 3.6 |
| 🇧🇷 Brazil | 3.4 |
| 🇦🇪 UAE | 3.4 |
| 🇰🇼 Kuwait | 2.7 |
| 🌍 Other | 22.8 |
These three nations have consistently dominated oil production since 1971. The leading position, however, has alternated among them over the past five decades.
In contrast, the combined production of the next three largest producers—Canada, Iraq, and China—reached 13.1 million barrels per day in 2023, just surpassing the production of the United States alone.
In the near term, no country is likely to surpass the record production achieved by the U.S. in 2023, as no other producer has ever reached a daily capacity of 13.0 million barrels. Recently, Saudi Arabia’s state-owned Saudi Aramco scrapped plans to increase production capacity to 13.0 million barrels per day by 2027.
In 2024, analysts forecast that the U.S. will maintain its position as the top oil producer. In fact, according to Macquarie Group, U.S. oil production is expected to achieve a record pace of about 14 million barrels per day by the end of the year.
Energy Shift
How Much Does the U.S. Depend on Russian Uranium?
Despite a new uranium ban being discussed in Congress, the U.S. is still heavily dependent on Russian uranium.

How Much Does the U.S. Depend on Russian Uranium?
This was originally posted on our Voronoi app. Download the app for free on iOS or Android and discover incredible data-driven charts from a variety of trusted sources.
The U.S. House of Representatives recently passed a ban on imports of Russian uranium. The bill must pass the Senate before becoming law.
In this graphic, we visualize how much the U.S. relies on Russian uranium, based on data from the United States Energy Information Administration (EIA).
U.S. Suppliers of Enriched Uranium
After Russia invaded Ukraine, the U.S. imposed sanctions on Russian-produced oil and gas—yet Russian-enriched uranium is still being imported.
Currently, Russia is the largest foreign supplier of nuclear power fuel to the United States. In 2022, Russia supplied almost a quarter of the enriched uranium used to fuel America’s fleet of more than 90 commercial reactors.
| Country of enrichment service | SWU* | % |
|---|---|---|
| 🇺🇸 United States | 3,876 | 27.34% |
| 🇷🇺 Russia | 3,409 | 24.04% |
| 🇩🇪 Germany | 1,763 | 12.40% |
| 🇬🇧 United Kingdom | 1,593 | 11.23% |
| 🇳🇱 Netherlands | 1,303 | 9.20% |
| Other | 2,232 | 15.79% |
| Total | 14,176 | 100% |
SWU stands for “Separative Work Unit” in the uranium industry. It is a measure of the amount of work required to separate isotopes of uranium during the enrichment process. Source: U.S. Energy Information Administration
Most of the remaining uranium is imported from European countries, while another portion is produced by a British-Dutch-German consortium operating in the United States called Urenco.
Similarly, nearly a dozen countries around the world depend on Russia for more than half of their enriched uranium—and many of them are NATO-allied members and allies of Ukraine.
In 2023 alone, the U.S. nuclear industry paid over $800 million to Russia’s state-owned nuclear energy corporation, Rosatom, and its fuel subsidiaries.
It is important to note that 19% of electricity in the U.S. is powered by nuclear plants.
The dependency on Russian fuels dates back to the 1990s when the United States turned away from its own enrichment capabilities in favor of using down-blended stocks of Soviet-era weapons-grade uranium.
As part of the new uranium-ban bill, the Biden administration plans to allocate $2.2 billion for the expansion of uranium enrichment facilities in the United States.

-

 Electrification3 years ago
Ranked: The Top 10 EV Battery Manufacturers
-

 Electrification2 years ago
The Key Minerals in an EV Battery
-

 Real Assets3 years ago
The World’s Top 10 Gold Mining Companies
-

 Misc3 years ago
All the Metals We Mined in One Visualization
-

 Electrification3 years ago
The Biggest Mining Companies in the World in 2021
-

 Energy Shift2 years ago
What Are the Five Major Types of Renewable Energy?
-

 Electrification2 years ago
The World’s Largest Nickel Mining Companies
-

 Electrification2 years ago
Mapped: Solar Power by Country in 2021