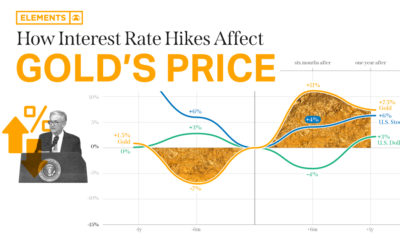

Gold's price has historically rallied after interest rate hikes, but will history repeat itself in upcoming tightening cycles?
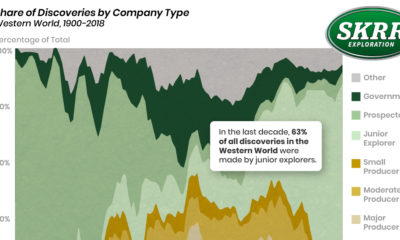

Visualizing the Genealogy of Exploration Success In the last decade, 63% of all mineral discoveries in the Western world were made by junior explorers. These small...


Together, the world’s top 10 gold mining companies account for roughly 22% of the share of the total gold market.
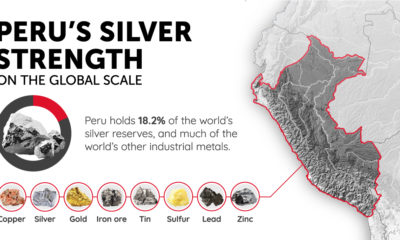

With a rich history of mining, Peru plays a vital role in supplying the world with silver for clean energy technologies and electrification.
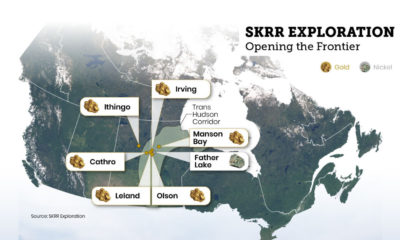

The Next Frontier: Mineral Exploration in Saskatchewan Lying in the heart of Canada is the next great mineral exploration frontier, Saskatchewan. This humble province lies at...
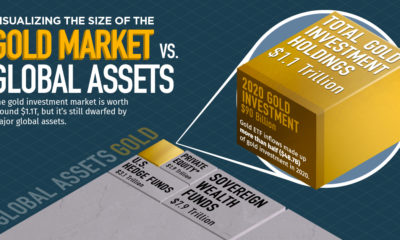

Gold is an important hedge against inflation and currency depreciation, but how does the precious metal compare against global assets?
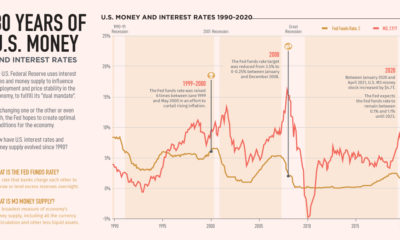

2020 brought about massive changes in U.S. monetary policy, with a 25% increase in M3 money supply and near-zero interest rates.
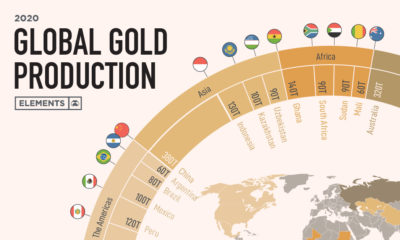

The world produced 3,200 tonnes of gold in 2020, a 3% drop relative to 2019. This graphic breaks down global gold production by country.


The graphic takes a look at the world’s largest mining companies by market capitalization and the metals they produce.
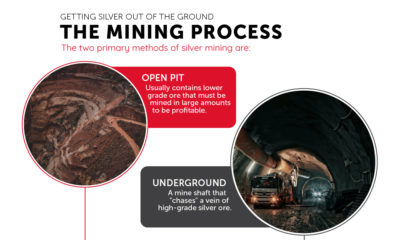

This graphic illustrates the silver mining journey and explores the reasons why it is an essential metal in the green energy transformation.


