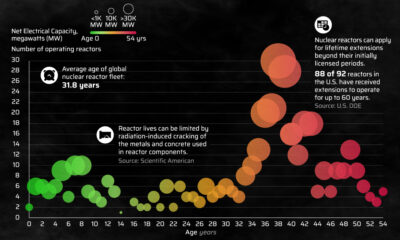

Of the 422 nuclear reactors operating globally, 262 reactors are 31 to 50 years old. This infographic charts nuclear reactors by age in 2023.
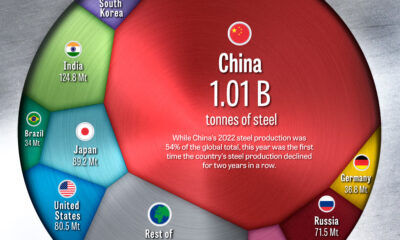

China has dominated global steel production the past few decades, but how did the country get here, and is its production growth over?
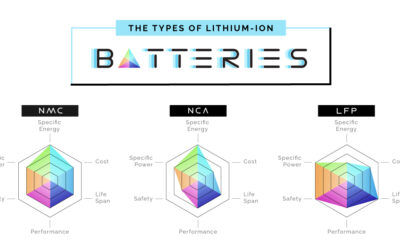

This infographic compares the six major types of lithium-ion batteries in terms of performance, safety, lifespan, and other dimensions.


Globally, central banks bought a record 1,136 tonnes of gold in 2022. How has central bank gold demand changed over the last three decades?


While Russia still makes billions from fossil fuel exports, revenues are declining. Here are the largest importers since the start of the invasion.


How much oil, coal, and natural gas do we extract each year? See the scale of annual fossil fuel production in perspective.
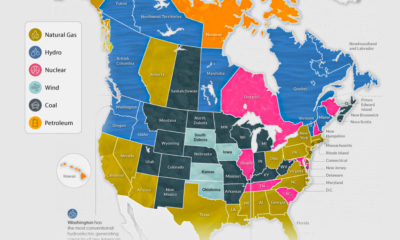

The U.S. and Canada rely on a different makeup of sources to generate their electricity. How does each state and province make theirs?


Curious how much of a metal you get for $1,000? This infographic compares the amount of precious and industrial metals worth $1,000.
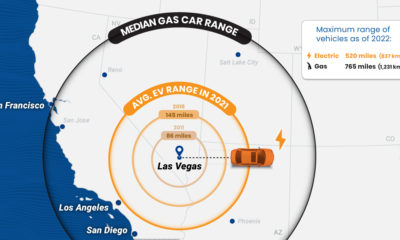

How does the range of electric cars compare with that of gas cars?
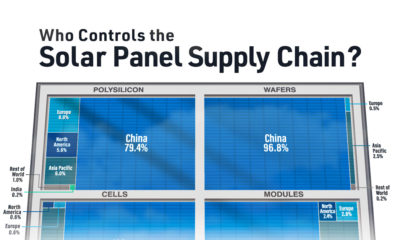

The supply chain is key for the renewable energy revolution, and this chart visualizes where the world's solar panels are manufactured.