

Energy Shift
Mapped: Asia’s Biggest Sources of Electricity by Country
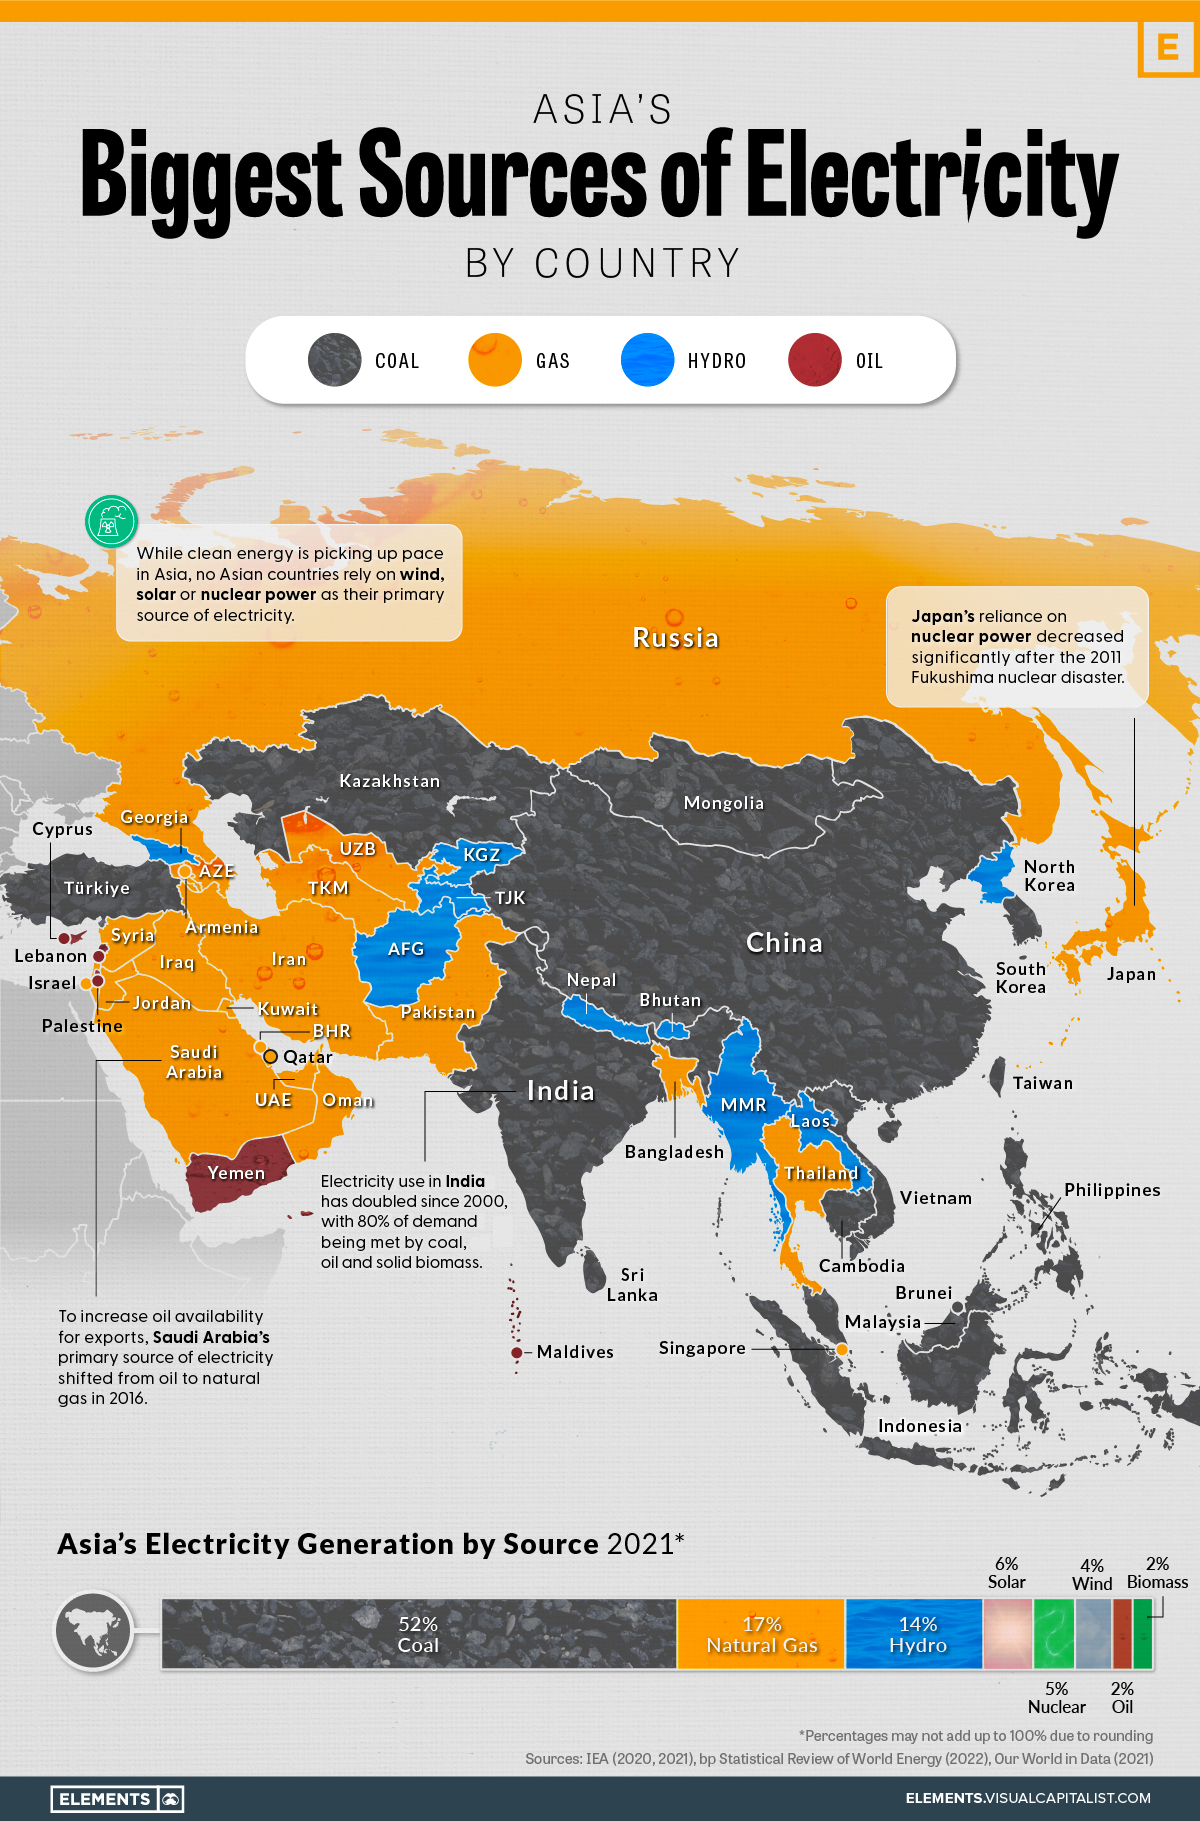


Mapped: Asia’s Biggest Sources of Electricity by Country
The International Energy Agency (IEA) predicts that Asia will account for half of the world’s electricity consumption by 2025, with one-third of global electricity being consumed in China.
To explore how this growing electricity demand is currently being met, the above graphic maps out Asia’s main sources of electricity by country, using data from the BP Statistical Review of World Energy and the IEA.
A Coal-Heavy Electricity Mix
Although clean energy has been picking up pace in Asia, coal currently makes up more than half of the continent’s electricity generation.
No Asian countries rely on wind, solar, or nuclear energy as their primary source of electricity, despite the combined share of these sources doubling over the last decade.
| % of total electricity mix, 2011 | % of total electricity mix, 2021 | |
|---|---|---|
| Coal | 55% | 52% |
| Natural Gas | 19% | 17% |
| Hydro | 12% | 14% |
| Nuclear | 5% | 5% |
| Wind | 1% | 4% |
| Solar | 0% | 4% |
| Oil | 6% | 2% |
| Biomass | 1% | 2% |
| Total Electricity Generated | 9,780 terawatt-hours | 15,370 terawatt-hours |
The above comparison shows that the slight drops in the continent’s reliance on coal, natural gas, and oil in the last decade have been absorbed by wind, solar, and hydropower. The vast growth in total electricity generated, however, means that a lot more fossil fuels are being burned now (in absolute terms) than at the start of the last decade, despite their shares dropping.
Following coal, natural gas comes in second place as Asia’s most used electricity source, with most of this demand coming from the Middle East and Russia.
Zooming in: China’s Big Electricity Demand
While China accounted for just 5% of global electricity demand in 1990, it is en route to account for 33% by 2025. The country is already the largest electricity producer in the world by far, annually generating nearly double the electricity produced by the second largest electricity producer in the world, the United States.
With such a large demand, the current source of China’s electricity is worthy of consideration, as are its plans for its future electricity mix.
Currently, China is one of the 14 Asian countries that rely on coal as its primary source of electricity. In 2021, the country drew 62% of its electricity from coal, a total of 5,339 TWh of energy. To put that into perspective, this is approximately three times all of the electricity generated in India in the same year.
Following coal, the remainder of China’s electricity mix is as follows.
| Source | % of total electricity mix (China, 2021) |
|---|---|
| Coal | 62% |
| Hydropower | 15% |
| Wind | 8% |
| Nuclear | 5% |
| Solar | 4% |
| Natural Gas | 3% |
| Biomass | 2% |
Despite already growing by 1.5x in the last decade, China’s demand for electricity is still growing. Recent developments in the country’s clean energy infrastructure point to most of this growth being met by renewables.
China does also have ambitious plans in place for its clean energy transition beyond the next few years. These include increasing its solar capacity by 667% between 2025 and 2060, as well as having wind as its primary source of electricity by 2060.
Asia’s Road to Clean Energy
According to the IEA, the world reached a new all-time high in power generation-related emissions in 2022, primarily as a result of the growth in fossil-fuel-generated electricity in the Asia Pacific.
With that said, these emissions are set to plateau by 2025, with a lot of the global growth in renewables and nuclear power being seen in Asia.
Currently, nuclear power is of particular interest in the continent, especially with 2022’s energy crisis highlighting the need for energy independence and security. India, for instance, is set to have an 80% growth in its nuclear electricity generation in the next two years, with Japan, South Korea, and China following suit in increasing their nuclear capacity.
The road ahead also hints at other interesting insights, specifically when it comes to hydropower in Asia. With heatwaves and droughts becoming more and more commonplace as a result of climate change, the continent may be poised to learn some lessons from Europe’s record-low hydropower generation in 2022, diverting its time and resources to other forms of clean energy, like wind and solar.
Whatever the future holds, one thing is clear: with ambitious plans already underway, Asia’s electricity mix may look significantly different within the next few decades.


Energy Shift
The World’s Biggest Oil Producers in 2023
Just three countries accounted for 40% of global oil production last year.

The World’s Biggest Oil Producers in 2023
This was originally posted on our Voronoi app. Download the app for free on iOS or Android and discover incredible data-driven charts from a variety of trusted sources.
Despite efforts to decarbonize the global economy, oil still remains one of the world’s most important resources. It’s also produced by a fairly limited group of countries, which can be a source of economic and political leverage.
This graphic illustrates global crude oil production in 2023, measured in million barrels per day, sourced from the U.S. Energy Information Administration (EIA).
Three Countries Account for 40% of Global Oil Production
In 2023, the United States, Russia, and Saudi Arabia collectively contributed 32.7 million barrels per day to global oil production.
| Oil Production 2023 | Million barrels per day |
|---|---|
| 🇺🇸 U.S. | 12.9 |
| 🇷🇺 Russia | 10.1 |
| 🇸🇦 Saudi Arabia | 9.7 |
| 🇨🇦 Canada | 4.6 |
| 🇮🇶 Iraq | 4.3 |
| 🇨🇳 China | 4.2 |
| 🇮🇷 Iran | 3.6 |
| 🇧🇷 Brazil | 3.4 |
| 🇦🇪 UAE | 3.4 |
| 🇰🇼 Kuwait | 2.7 |
| 🌍 Other | 22.8 |
These three nations have consistently dominated oil production since 1971. The leading position, however, has alternated among them over the past five decades.
In contrast, the combined production of the next three largest producers—Canada, Iraq, and China—reached 13.1 million barrels per day in 2023, just surpassing the production of the United States alone.
In the near term, no country is likely to surpass the record production achieved by the U.S. in 2023, as no other producer has ever reached a daily capacity of 13.0 million barrels. Recently, Saudi Arabia’s state-owned Saudi Aramco scrapped plans to increase production capacity to 13.0 million barrels per day by 2027.
In 2024, analysts forecast that the U.S. will maintain its position as the top oil producer. In fact, according to Macquarie Group, U.S. oil production is expected to achieve a record pace of about 14 million barrels per day by the end of the year.
Energy Shift
How Much Does the U.S. Depend on Russian Uranium?
Despite a new uranium ban being discussed in Congress, the U.S. is still heavily dependent on Russian uranium.

How Much Does the U.S. Depend on Russian Uranium?
This was originally posted on our Voronoi app. Download the app for free on iOS or Android and discover incredible data-driven charts from a variety of trusted sources.
The U.S. House of Representatives recently passed a ban on imports of Russian uranium. The bill must pass the Senate before becoming law.
In this graphic, we visualize how much the U.S. relies on Russian uranium, based on data from the United States Energy Information Administration (EIA).
U.S. Suppliers of Enriched Uranium
After Russia invaded Ukraine, the U.S. imposed sanctions on Russian-produced oil and gas—yet Russian-enriched uranium is still being imported.
Currently, Russia is the largest foreign supplier of nuclear power fuel to the United States. In 2022, Russia supplied almost a quarter of the enriched uranium used to fuel America’s fleet of more than 90 commercial reactors.
| Country of enrichment service | SWU* | % |
|---|---|---|
| 🇺🇸 United States | 3,876 | 27.34% |
| 🇷🇺 Russia | 3,409 | 24.04% |
| 🇩🇪 Germany | 1,763 | 12.40% |
| 🇬🇧 United Kingdom | 1,593 | 11.23% |
| 🇳🇱 Netherlands | 1,303 | 9.20% |
| Other | 2,232 | 15.79% |
| Total | 14,176 | 100% |
SWU stands for “Separative Work Unit” in the uranium industry. It is a measure of the amount of work required to separate isotopes of uranium during the enrichment process. Source: U.S. Energy Information Administration
Most of the remaining uranium is imported from European countries, while another portion is produced by a British-Dutch-German consortium operating in the United States called Urenco.
Similarly, nearly a dozen countries around the world depend on Russia for more than half of their enriched uranium—and many of them are NATO-allied members and allies of Ukraine.
In 2023 alone, the U.S. nuclear industry paid over $800 million to Russia’s state-owned nuclear energy corporation, Rosatom, and its fuel subsidiaries.
It is important to note that 19% of electricity in the U.S. is powered by nuclear plants.
The dependency on Russian fuels dates back to the 1990s when the United States turned away from its own enrichment capabilities in favor of using down-blended stocks of Soviet-era weapons-grade uranium.
As part of the new uranium-ban bill, the Biden administration plans to allocate $2.2 billion for the expansion of uranium enrichment facilities in the United States.

-

 Electrification3 years ago
Ranked: The Top 10 EV Battery Manufacturers
-

 Electrification2 years ago
The Key Minerals in an EV Battery
-

 Real Assets3 years ago
The World’s Top 10 Gold Mining Companies
-

 Misc3 years ago
All the Metals We Mined in One Visualization
-

 Electrification3 years ago
The Biggest Mining Companies in the World in 2021
-

 Energy Shift2 years ago
What Are the Five Major Types of Renewable Energy?
-

 Electrification2 years ago
Mapped: Solar Power by Country in 2021
-

 Electrification2 years ago
The World’s Largest Nickel Mining Companies