

Real Assets
12 Stunning Visualizations of Gold Show Its Rarity
For the companies exploring for gold, a deposit that has more than one gram of gold for every tonne of earth is an exciting prospect. In fact, in our 2013 report summarizing the world’s gold deposits, we found that the average grade of gold deposits in the world is around that amount: about 1.01 g/t.
Think about that for a moment. One gram (0.035 oz) is equal to the mass of a small paper clip. This small amount of gold is usually not even in one place – it is dispersed through a tonne of rock and dirt in smaller amounts, most of the time invisible to the naked eye. For some companies that have the stars align with easy metallurgy, a deposit near surface, and open pit potential, this gram per tonne deposit may even somehow be economic.
It’s hard to believe that such a small amount of gold could be worth so much, and that is why great visualizations can help us understand the rarity of this yellow metal. Luckily, the folks at Demonocracy.info have done the heavy lifting for us, putting together a series of 3D visualizations of gold bullion bars showcasing the world’s gold that has been mined thus far. Note: these visualizations are a couple of years old and optimistically have the value of gold pegged at US$2,000 per oz, presumably for the ease of calculations.
For those interested, we have also put together a similar slideshow on the topic, showing how much gold, silver, copper, and other metals are mined each year.
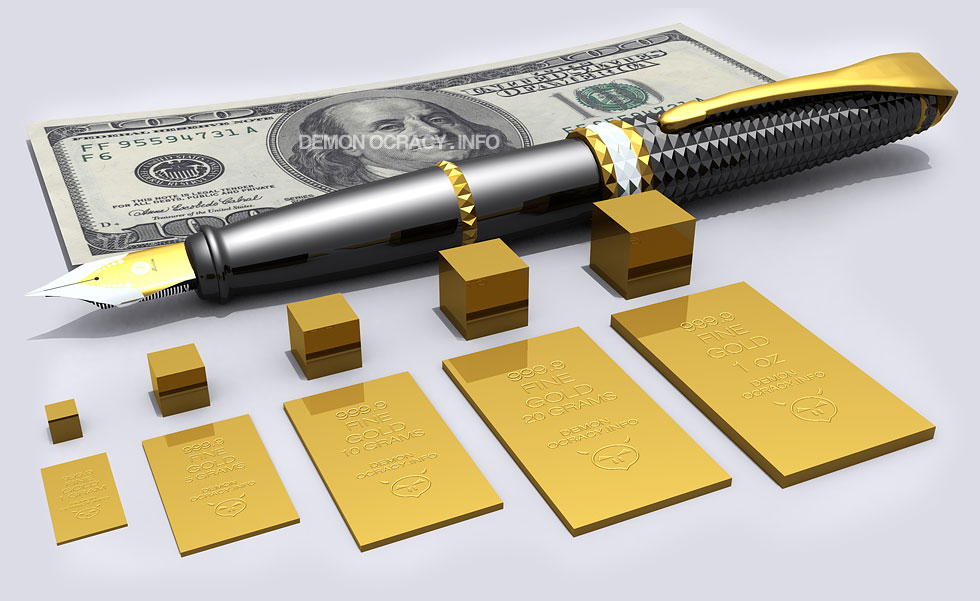
Smaller denominations of gold plates: 1 gram, 5 grams, 10 grams, 20 grams, and 1 troy oz of gold.
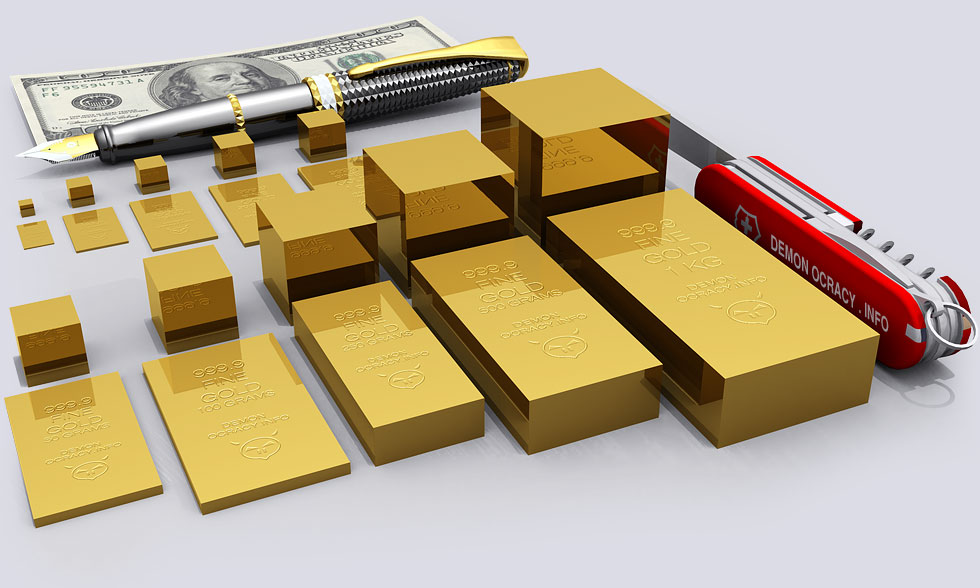
Larger denominations of gold plates: 50 grams, 100 grams, 250 grams, 500 grams, and 1 kg of gold.
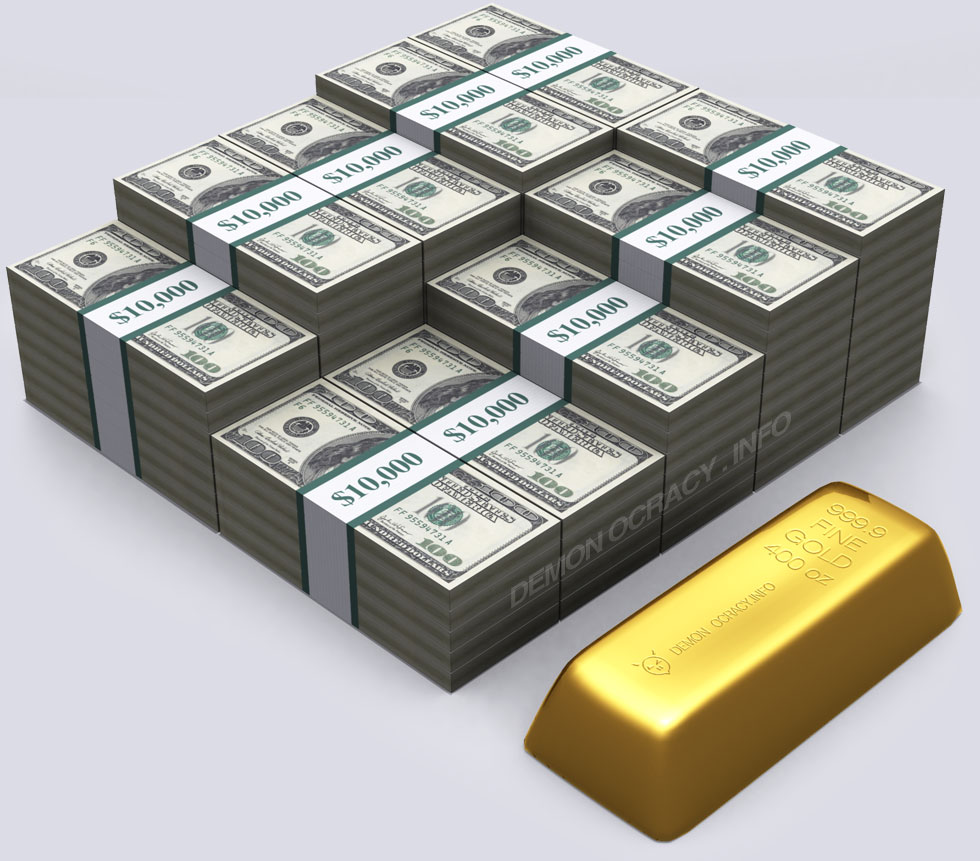
This 400 oz gold bar, at $2,000 per oz gold, is worth the $800,000 cash beside it. The gold bar is extremely heavy, weighing more than three full milk jugs.
Here’s what one tonne of gold looks like. At $2,000 per oz, it’s worth $64.3 million.
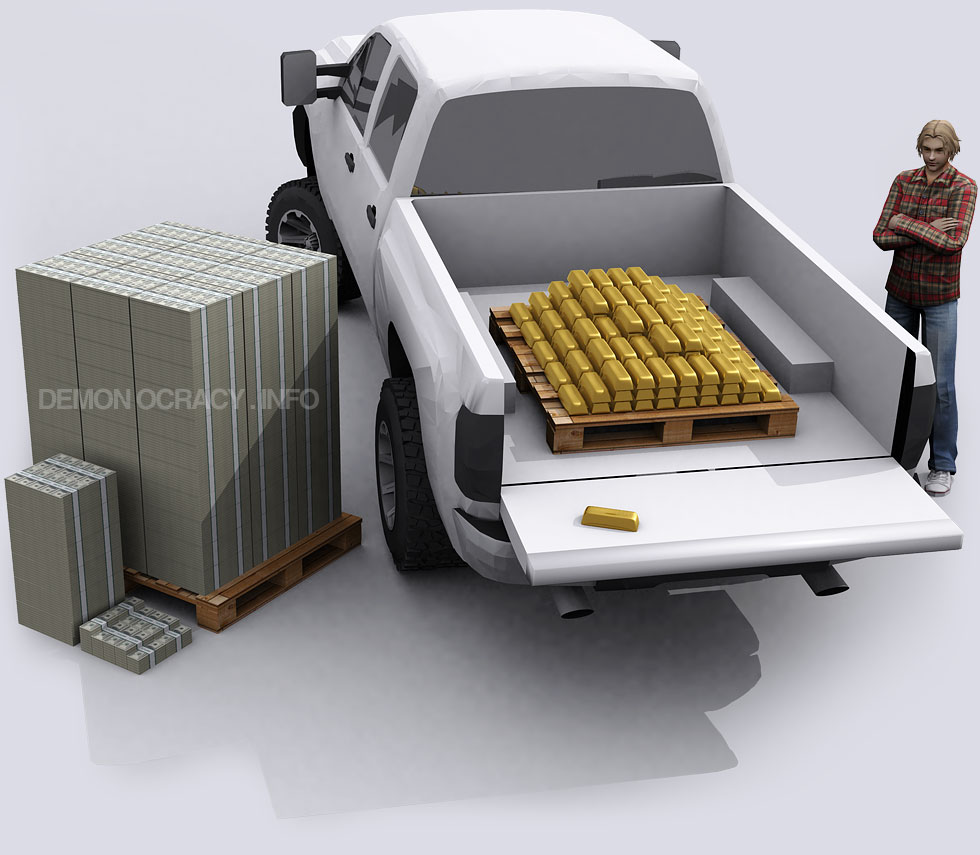
Gold is so heavy that the suspension of an average truck would break if it held anymore than pictured above. Even if the truck’s suspension broke, the load of gold in the back could buy 2,660 brand new trucks at an MSRP of $40,000 per truck.

Here’s 10 tonnes of gold compared to 100 tonnes of the yellow metal.

This semi-truck is carrying the maximum load it can legally carry, which is about about 25 tonnes. Here there are 24.88 tonnes of gold, worth $1.6 billion.

The Northrop Grumman B2 Spirit Bomber program cost $44.75 Billion for a total of 21 units built, which averages to $2,130,952,380 per unit. Shown here is the amount of gold it costs to buy one unit.
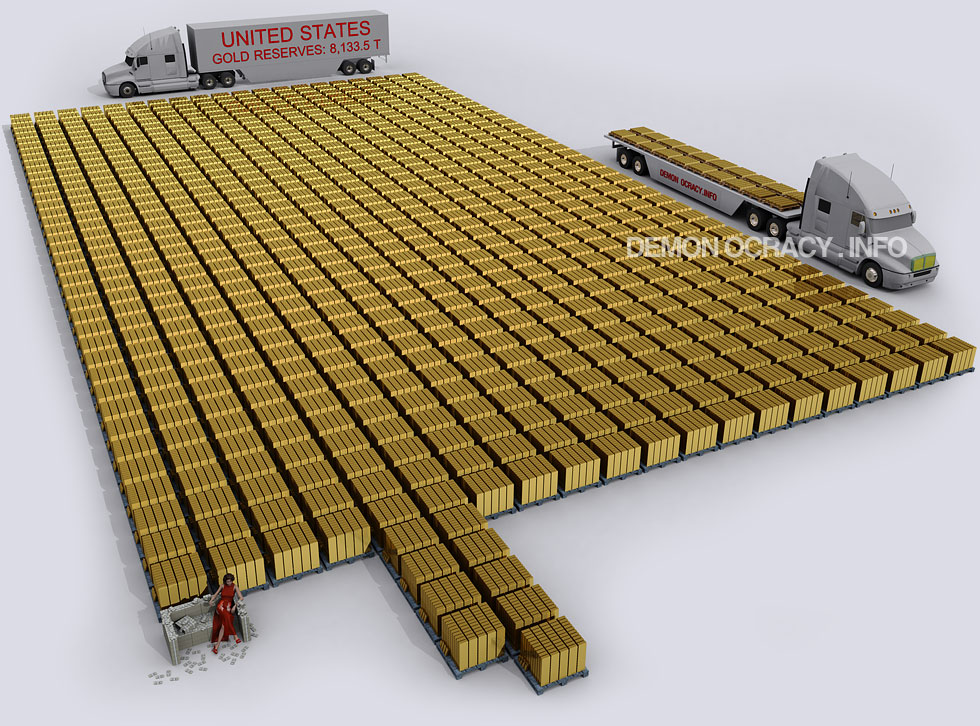
Here’s the entire gold reserves of the United States government, which is 8,133.5 tonnes.
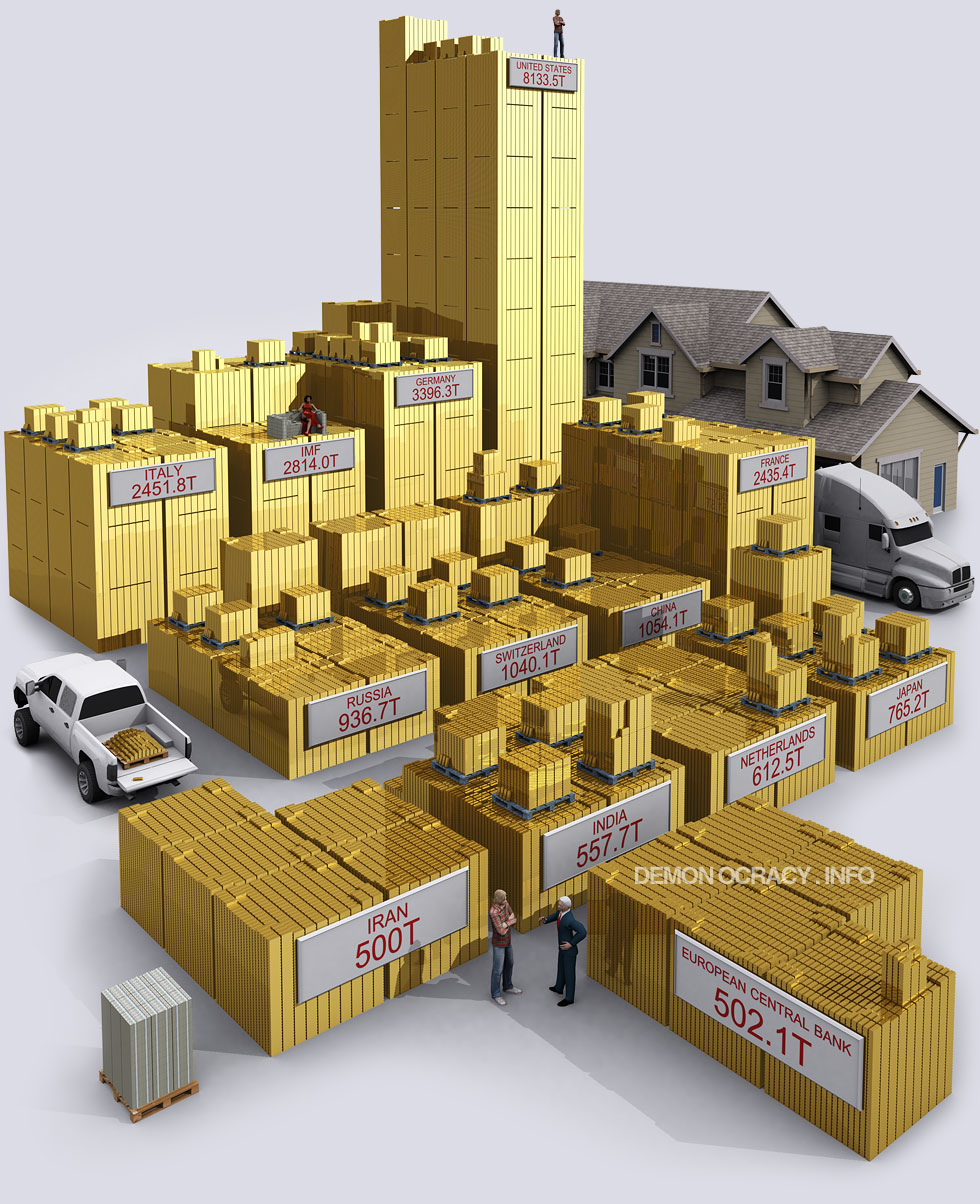
Here’s the world’s gold reserves by government circa 2012. This is slightly outdated, with China and Russia both having significant increases since then.

All gold mined in history, stacked in 400 oz bars. The 166,500 tonnes here is actually divided into four levels: the bottom level is jewelry (50.5% of all gold), the 2nd level is private investment (18.7%), the third level is world governments (17.4%), and the highest level is other uses for gold such as industry (13.4%).
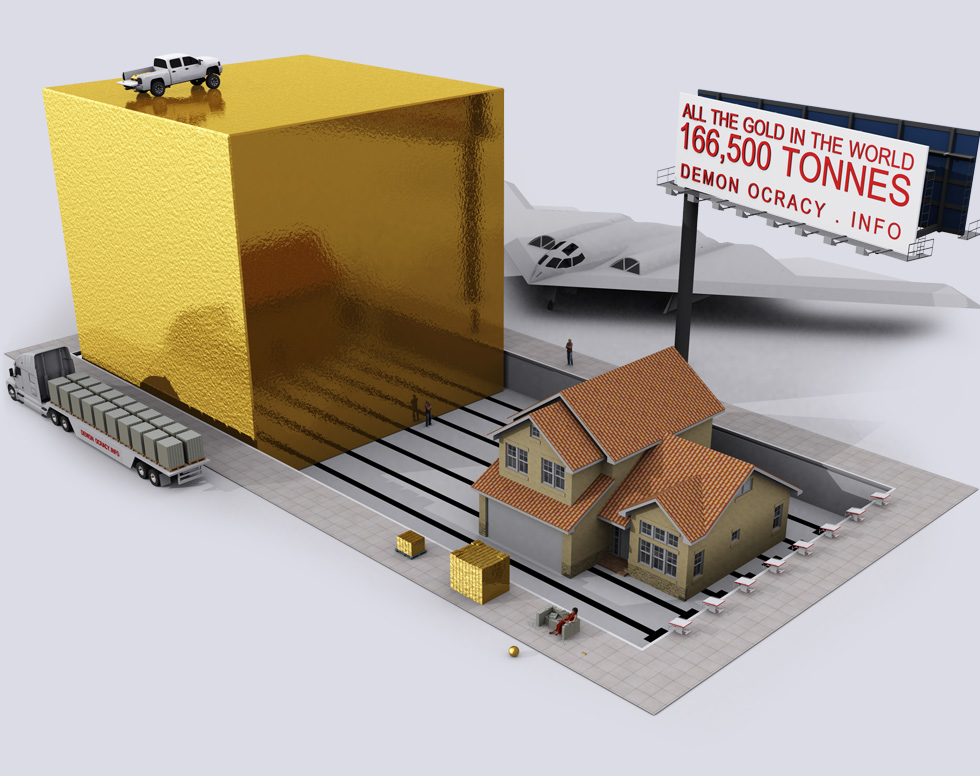
Lastly, we finish off with an image of all of the world’s mined gold in one cube with dimensions of 20.5m. If it was all melted, it would fit within the confines of an Olympic Swimming Pool.
Want to learn everything you need to know about gold in about 20 minutes? Our five-part Gold Series covers everything from its rich history, supply and geology, demand drivers, investment properties, and market trends.


Real Assets
Charted: The Value Gap Between the Gold Price and Gold Miners
While gold prices hit all-time highs, gold mining stocks have lagged far behind.

Gold Price vs. Gold Mining Stocks
This was originally posted on our Voronoi app. Download the app for free on Apple or Android and discover incredible data-driven charts from a variety of trusted sources.
Although the price of gold has reached new record highs in 2024, gold miners are still far from their 2011 peaks.
In this graphic, we illustrate the evolution of gold prices since 2000 compared to the NYSE Arca Gold BUGS Index (HUI), which consists of the largest and most widely held public gold production companies. The data was compiled by Incrementum AG.
Mining Stocks Lag Far Behind
In April 2024, gold reached a new record high as Federal Reserve Chair Jerome Powell signaled policymakers may delay interest rate cuts until clearer signs of declining inflation materialize.
Additionally, with elections occurring in more than 60 countries in 2024 and ongoing conflicts in Ukraine and Gaza, central banks are continuing to buy gold to strengthen their reserves, creating momentum for the metal.
Traditionally known as a hedge against inflation and a safe haven during times of political and economic uncertainty, gold has climbed over 11% so far this year.
According to Business Insider, gold miners experienced their best performance in a year in March 2024. During that month, the gold mining sector outperformed all other U.S. industries, surpassing even the performance of semiconductor stocks.
Still, physical gold has outperformed shares of gold-mining companies over the past three years by one of the largest margins in decades.
| Year | Gold Price | NYSE Arca Gold BUGS Index (HUI) |
|---|---|---|
| 2023 | $2,062.92 | $243.31 |
| 2022 | $1,824.32 | $229.75 |
| 2021 | $1,828.60 | $258.87 |
| 2020 | $1,895.10 | $299.64 |
| 2019 | $1,523.00 | $241.94 |
| 2018 | $1,281.65 | $160.58 |
| 2017 | $1,296.50 | $192.31 |
| 2016 | $1,151.70 | $182.31 |
| 2015 | $1,060.20 | $111.18 |
| 2014 | $1,199.25 | $164.03 |
| 2013 | $1,201.50 | $197.70 |
| 2012 | $1,664.00 | $444.22 |
| 2011 | $1,574.50 | $498.73 |
| 2010 | $1,410.25 | $573.32 |
| 2009 | $1,104.00 | $429.91 |
| 2008 | $865.00 | $302.41 |
| 2007 | $836.50 | $409.37 |
| 2006 | $635.70 | $338.24 |
| 2005 | $513.00 | $276.90 |
| 2004 | $438.00 | $215.33 |
| 2003 | $417.25 | $242.93 |
| 2002 | $342.75 | $145.12 |
| 2001 | $276.50 | $65.20 |
| 2000 | $272.65 | $40.97 |
Among the largest companies on the NYSE Arca Gold BUGS Index, Colorado-based Newmont has experienced a 24% drop in its share price over the past year. Similarly, Canadian Barrick Gold also saw a decline of 6.5% over the past 12 months.
Real Assets
200 Years of Global Gold Production, by Country
Global gold production has grown exponentially since the 1800s, with 86% of all above-ground gold mined in the last 200 years.


Visualizing Global Gold Production Over 200 Years
Although the practice of gold mining has been around for thousands of years, it’s estimated that roughly 86% of all above-ground gold was extracted in the last 200 years.
With modern mining techniques making large-scale production possible, global gold production has grown exponentially since the 1800s.
The above infographic uses data from Our World in Data to visualize global gold production by country from 1820 to 2022, showing how gold mining has evolved to become increasingly global over time.
A Brief History of Gold Mining
The best-known gold rush in modern history occurred in California in 1848, when James Marshall discovered gold in Sacramento Valley. As word spread, thousands of migrants flocked to California in search of gold, and by 1855, miners had extracted around $2 billion worth of gold.
The United States, Australia, and Russia were (interchangeably) the three largest gold producers until the 1890s. Then, South Africa took the helm thanks to the massive discovery in the Witwatersrand Basin, now regarded today as one of the world’s greatest ever goldfields.
South Africa’s annual gold production peaked in 1970 at 1,002 tonnes—by far the largest amount of gold produced by any country in a year.
With the price of gold rising since the 1980s, global gold production has become increasingly widespread. By 2007, China was the world’s largest gold-producing nation, and today a significant quantity of gold is being mined in over 40 countries.
The Top Gold-Producing Countries in 2022
Around 31% of the world’s gold production in 2022 came from three countries—China, Russia, and Australia, with each producing over 300 tonnes of the precious metal.
| Rank | Country | 2022E Gold Production, tonnes | % of Total |
|---|---|---|---|
| #1 | 🇨🇳 China | 330 | 11% |
| #2 | 🇷🇺 Russia | 320 | 10% |
| #3 | 🇦🇺 Australia | 320 | 10% |
| #4 | 🇨🇦 Canada | 220 | 7% |
| #5 | 🇺🇸 United States | 170 | 5% |
| #6 | 🇲🇽 Mexico | 120 | 4% |
| #7 | 🇰🇿 Kazakhstan | 120 | 4% |
| #8 | 🇿🇦 South Africa | 110 | 4% |
| #9 | 🇵🇪 Peru | 100 | 3% |
| #10 | 🇺🇿 Uzbekistan | 100 | 3% |
| #11 | 🇬🇭 Ghana | 90 | 3% |
| #12 | 🇮🇩 Indonesia | 70 | 2% |
| - | 🌍 Rest of the World | 1,030 | 33% |
| - | World Total | 3,100 | 100% |
North American countries Canada, the U.S., and Mexico round out the top six gold producers, collectively making up 16% of the global total. The state of Nevada alone accounted for 72% of U.S. production, hosting the world’s largest gold mining complex (including six mines) owned by Nevada Gold Mines.
Meanwhile, South Africa produced 110 tonnes of gold in 2022, down by 74% relative to its output of 430 tonnes in 2000. This long-term decline is the result of mine closures, maturing assets, and industrial conflict, according to the World Gold Council.
Interestingly, two smaller gold producers on the list, Uzbekistan and Indonesia, host the second and third-largest gold mining operations in the world, respectively.
The Outlook for Global Gold Production
As of April 25, gold prices were hovering around the $2,000 per ounce mark and nearing all-time highs. For mining companies, higher gold prices can mean more profits per ounce if costs remain unaffected.
According to the World Gold Council, mined gold production is expected to increase in 2023 and could surpass the record set in 2018 (3,300 tonnes), led by the expansion of existing projects in North America. The chances of record mine output could be higher if gold prices continue to increase.

-

 Electrification3 years ago
Ranked: The Top 10 EV Battery Manufacturers
-

 Electrification2 years ago
The Key Minerals in an EV Battery
-

 Real Assets3 years ago
The World’s Top 10 Gold Mining Companies
-

 Misc3 years ago
All the Metals We Mined in One Visualization
-

 Electrification3 years ago
The Biggest Mining Companies in the World in 2021
-

 Energy Shift2 years ago
What Are the Five Major Types of Renewable Energy?
-

 Electrification2 years ago
The World’s Largest Nickel Mining Companies
-

 Electrification2 years ago
Mapped: Solar Power by Country in 2021